
Figure 1.
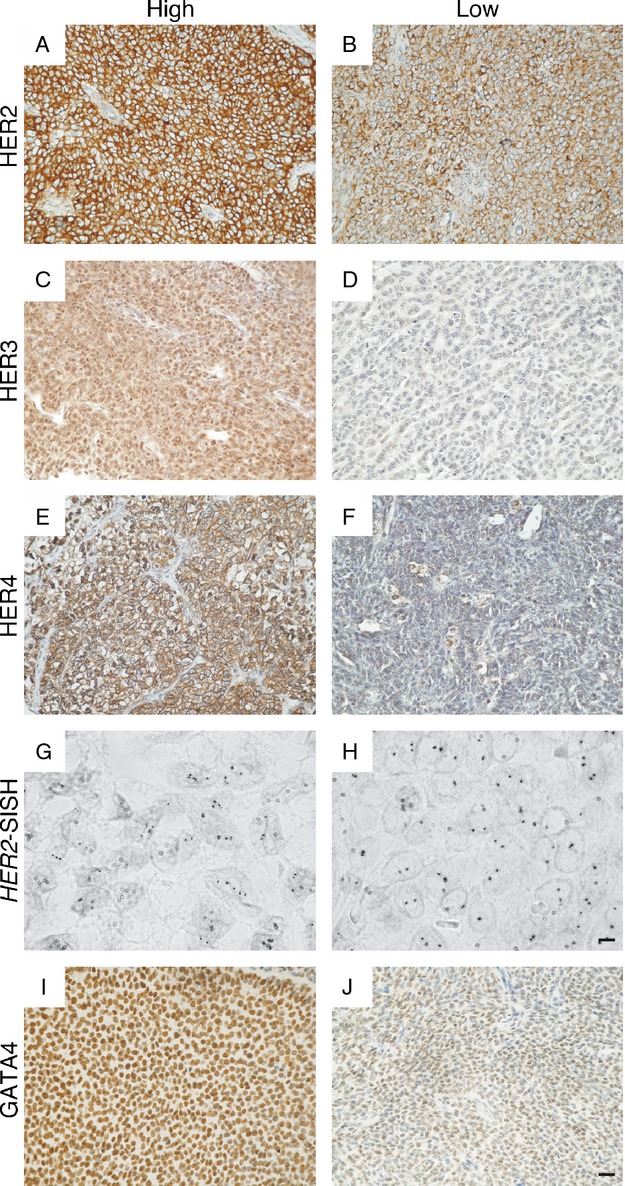
Representative images of HER2, HER3, HER4, and GATA4 immunohistochemical staining and HER2 silver in situ hybridization in adult GCTs. A GCT sample with (A) high-level expression and (B) low-level expression of HER2 on the cell membrane. High-level expression of HER3 localized into the nucleus and cytoplasm (C). In the majority of GCTs HER3 immunostaining was negligible (D). HER4 was localized into the cell membrane in both (E) high-level and (F) low-level expressing GCTs. Eight GCTs showed small-scale amplification of the HER2 gene (G), while gene copy number was normal in most tumors (H). High-level nuclear expression of the transcription factor GATA4 (I) and a GCT with low-level GATA4 expression (J). The magnification of (A–F, I, and J) is 20× and the scale bar represents 50 μm. The magnification of (G and H) is 100× and the scale bar represents 10 μm.