
Figure 2.
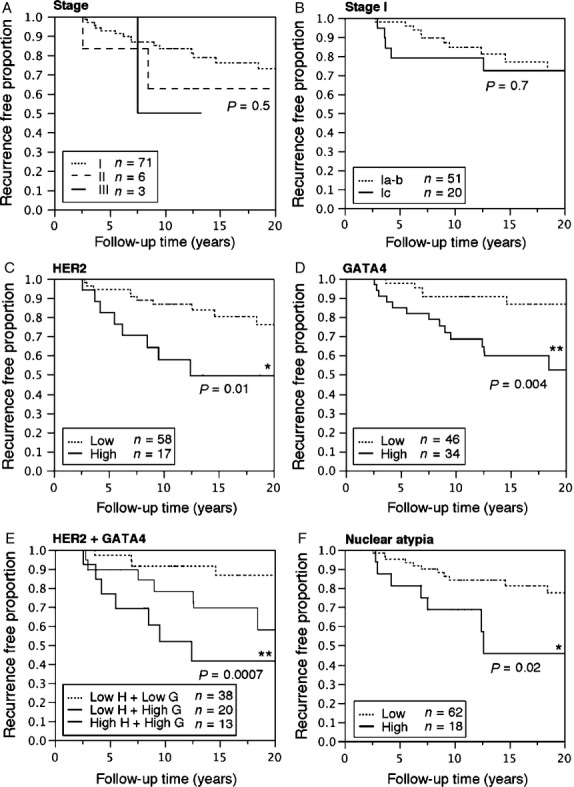
Kaplan–Meier plots of disease-free survival (DFS) to the first recurrence in 80 GCT patients according to tumor stage, expression of HER2 and GATA4, and nuclear atypia. Recurrence-free proportion of patients with either stage I, II, or III GCTs (A), and in patients with stage I tumors (B). The recurrence-free proportion of patients with tumors expressing low or high levels of HER2 (C), GATA4 (D), and in combinations (E) and in tumors having low-level or high-level nuclear atypia (F). H, HER2; G, GATA4. The Kaplan–Meier plot for the low G + high H group is not shown in E due to small sample size (n = 1), and the P-value in E is derived from analysis between the low H + low G versus the high H + high G expression groups. Log-rank test, differences between groups were considered significant when P < 0.05 (*P < 0.05, **P < 0.01).