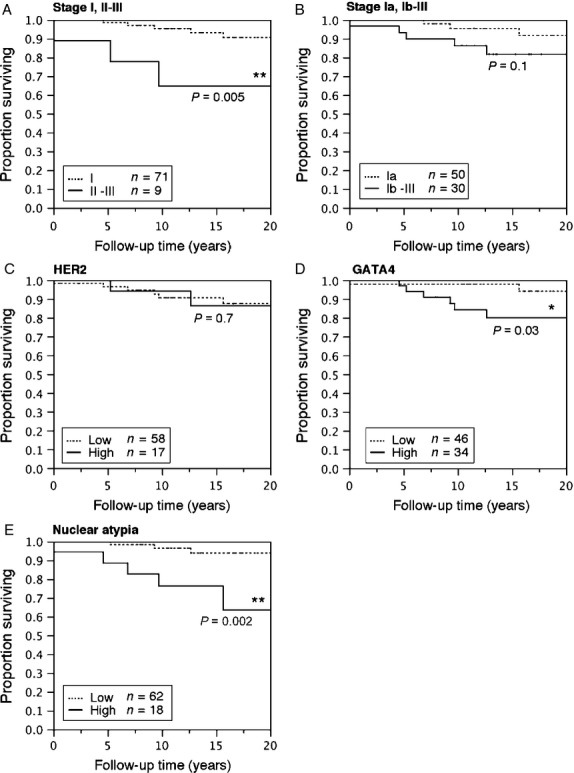
Figure 3.

Kaplan–Meier plots of disease-specific survival (DSS) of GCT patients according to tumor stage, expression of HER2 and GATA4, and nuclear atypia. Proportion of patients surviving with either stage I or II–III tumors (A), and with tumors of stage Ia or Ib–II (B). Proportion of patients surviving with tumors expressing low or high levels of GATA4 (C) and HER2 (D) and with tumors having low- or high-level nuclear atypia (E). Log-rank test, differences between groups were considered significant when P < 0.05 (*P < 0.05, **P < 0.01).
