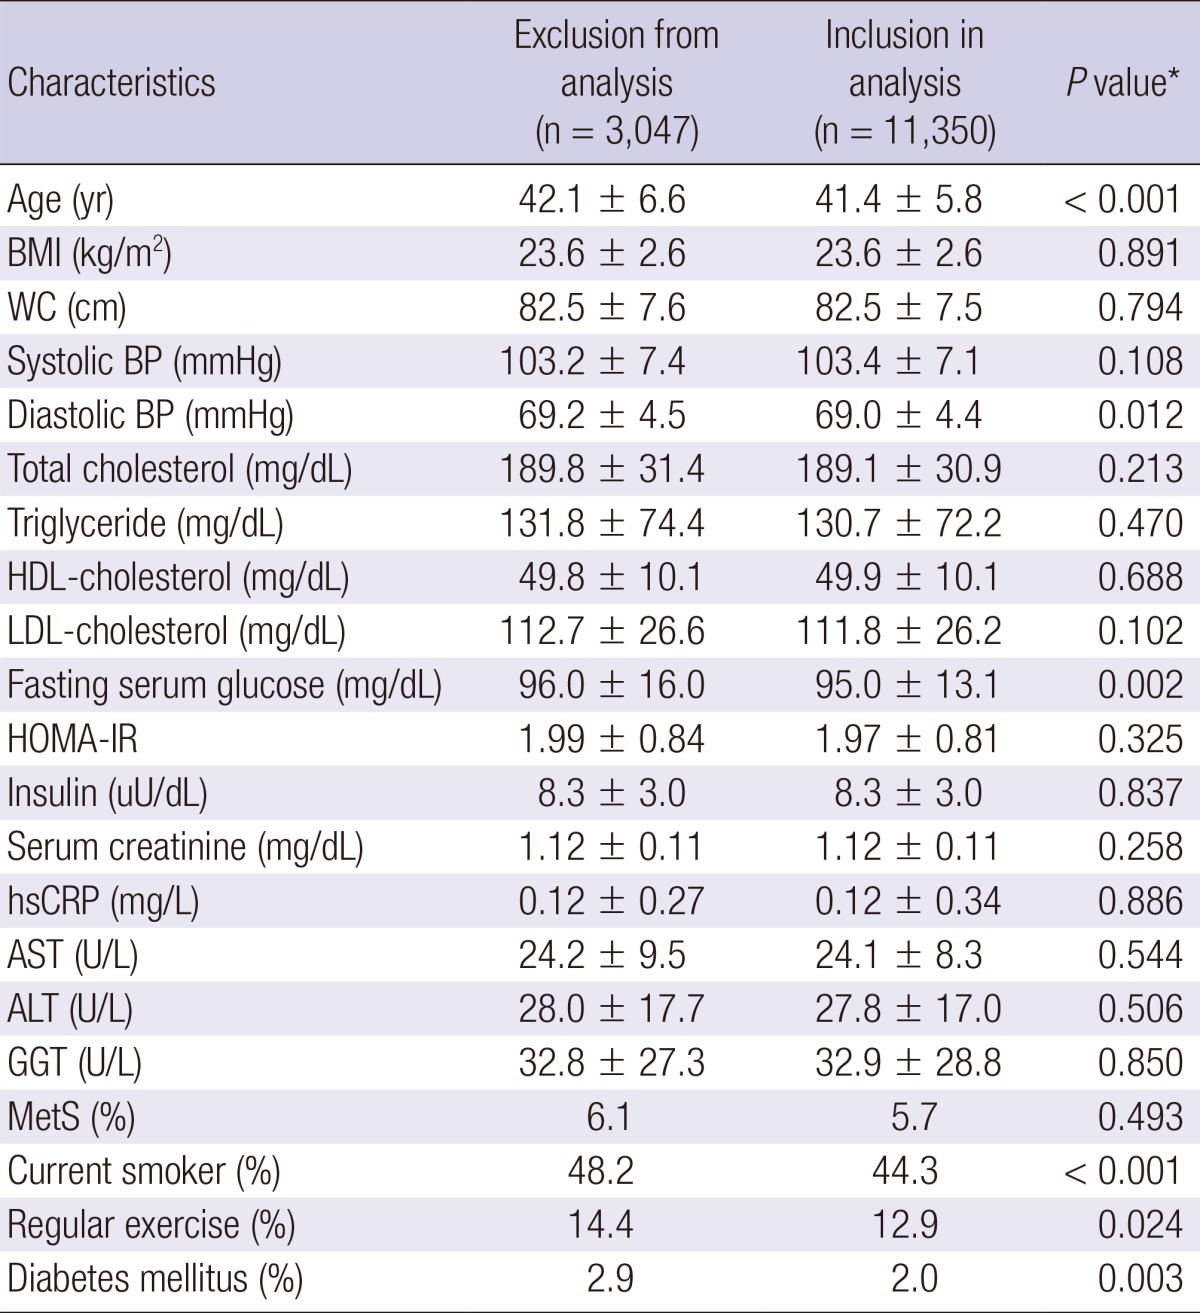
Table 1.
Comparison between exclusion from analysis and inclusion in analysis

Data are expressed as means±standard deviation or percentages. *P value by t-test for continuous variables and chi square test for categorical variables. BMI, body mass index; WC, waist circumference; BP, blood pressure; HDL, high density lipoprotein; LDL, low density lipoprotein; HOMA-IR, homeostasis model assessment of insulin resistance; hsCRP, high-sensitivity c-reactive protein; AST, aspartate aminotransferase; ALT, alanine aminotransferase; GGT, γ-glutamyltransferase; MetS, metabolic syndrome.
