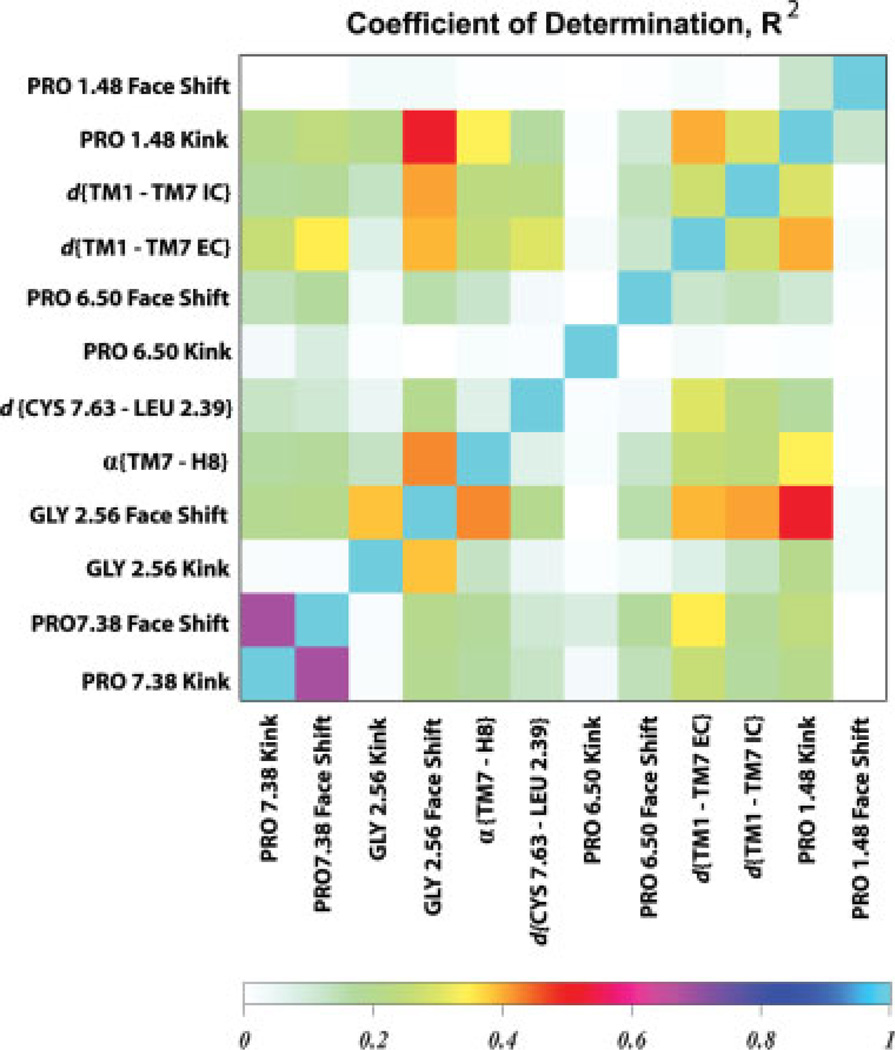
Figure 8.
Coefficient of determination, R2, matrix calculated for selected variables including proline kink parameters in TM1, TM2, TM6, and TM7, and dynamic quantities from Figure 6: d{TM1-TM7 IC}, d{TM1-TM7 EC}, α{TM7-H8}, and d{Cys7.63-Leu2.39}. The color code represents the strength of individual pair-wise correlations where “1” indicates perfect correlation (either positive or negative), and “0” represents no correlation between variables. [Color figure can be viewed in the online issue, which is available at www.interscience.wiley.com]

