Figure 1.
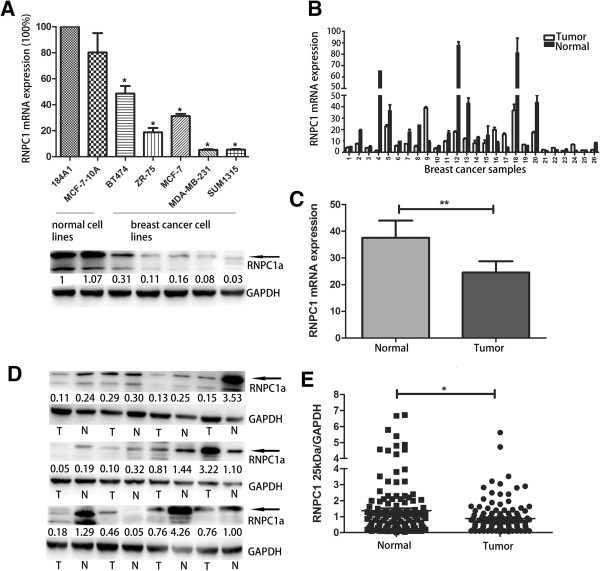
RNPC1 expressive in breast cancer cell lines and tissues. (A) qRT-PCR and Western blot analysis of RNPC1 expression in breast cancer cell lines and normal breast cell lines MCF-10A and 184A1. The two normal breast cell lines showed higher expression of RNPC1 than other cell lines (p < 0.05). The fold change of RNPC1a is shown below each lane. The intensity of the bands was determined using densitometric analysis. (B) RNPC1 mRNA expression in 121 pairs of breast cancer and adjacent tissue. 26 cases showed for example. (C) Average expression level of RNPC1 mRNA in 121 pairs of human breast cancer tissues and adjacent normal breast tissues. Adjacent breast tissues had higher expression of RNPC1, where the breast cancer tissues showed the lower level of expression (p < 0.01). (D) RNPC1 protein expression in 121 pairs of breast cancer and adjacent tissues. The 25 kDa band/GAPDH ratio was markedly lower in tumors compared to adjacent normal tissues. 12 cases showed for example. The fold change of RNPC1a is shown below each lane. The intensity of the bands was determined using densitometric analysis. (E) A scatter plot of RNPC1 protein expression in the same cancer tissue, adjacent tissue (p < 0.05). Data were means of two separate experiments mean ± SEM, *p < 0.05, **p < 0.01.

