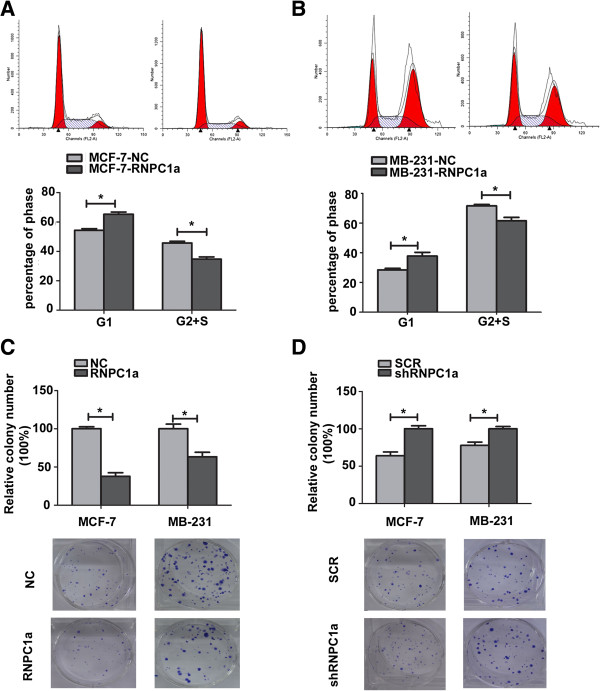
Figure 3.
RNPC1a suppressed anchorage dependent growth of breast cancer cells. (A,B) Cell cycle progression was measured using flow cytometry. The progression of MCF-7-RNPC1a and MB-231-RNPC1a cells was arrest in the G1 phase compared with control cells, respectively. Representative photographs (upper) and quantification (lower) are shown. (C) The growth of cells over 15 days was measured using colony formation assays. Clone formation of RNPC1a overexpression arbitrarily set at 100% in control cells (NC). The number and size of MCF-7-RNPC1a or MB-231-RNPC1a was significantly decreased compared to control cells, respectively. Representative photographs (lower) and quantification (upper) are shown. Data were means of three separate experiments mean ± SEM, p < 0.05. (D) Clone formation of RNPC1a knockdown arbitrarily set at 100% in knockdown (shRNPC1a) cells. The number and size of MCF-7-shRNPC1a or MB-231-shRNPC1a was significantly increased compared with control cells, respectively. Representative photographs (lower) and quantification (upper) are shown. Data were means of three separate experiments mean ± SEM, p < 0.05. Colonies > 50 mm were counted. Anchorage–dependent growth assays were shown at the bottom. Data were means of three separate experiments mean ± SEM, *p < 0.05.

