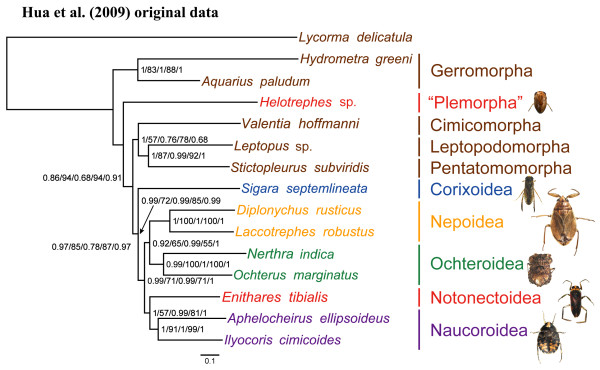
Figure 1.

The consensus phylogeny based on the data sets analyzed by Hua et al. [[28]]. Five of the eight phylogenetic analyses they conducted supported this tree. Numbers at the nodes indicate the BPP and ML support values for each data matrix analyzed by Hua et al. [28] in the following order: PP and BP for PCG123RT, PP and BP for PCG12RT, and PP for PCG12. Branch lengths are similar across analyses; these branch lengths represent the analysis of the PCG123RT data set. The scale bar represents the number of expected substitutions per site.
