
Figure 2.
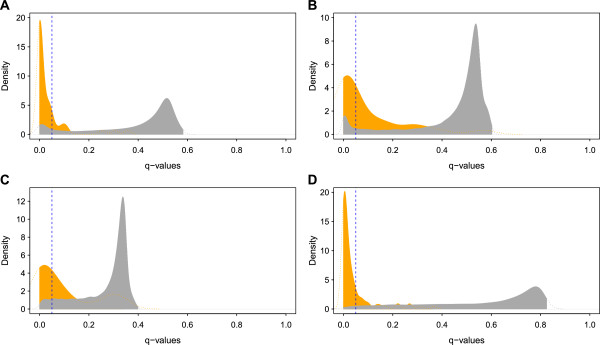
Density distribution of false discovery rate (q-values) of SNPs in significant clusters (orange) and the rest of the genome-wide SNPs (gray). Density plots are shown for polled cattle (A), double muscle cattle (B), polled sheep (C) and double muscle sheep (D). Vertical dashed (−−−−−) lines indicate q-values (FDR) = 0.05 in each subset. q-values were calculated from the calibrated p-values. Histograms of the mean Z, empirical and calibrated p-values are shown in Additional file 7: Figure S4. Relationship between q-values and calibrated p-values is shown in Additional file 8: Figure S5.