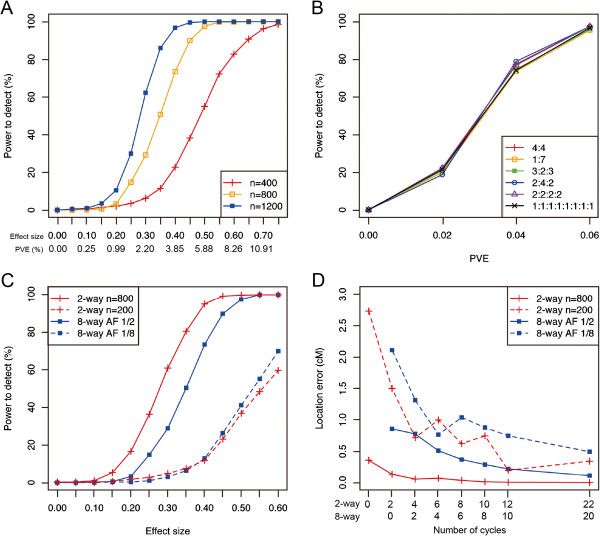
Figure 4.
Power to detect single additive QTLs in the rice eight-way IRIPs. Detailed conditions of this experiment are described in Table 2. (A) Power to detect a single additive QTL in the rice eight-way IRIPs. Values are the result of 400 simulations. (B) Comparison of the power to detect a single additive QTL between the bi-allelic case and the multi-allelic cases. Values are the result of 400 simulations. (C) Comparison of the power to detect a single additive QTL between the two-way and eight-way IRIPs. Values are the result of 400 simulations. (D) The location error for the detected QTLs. The location error equals the distance between the position of the maximum P-value and the true QTL position. Values are the result of 1000 simulations.

