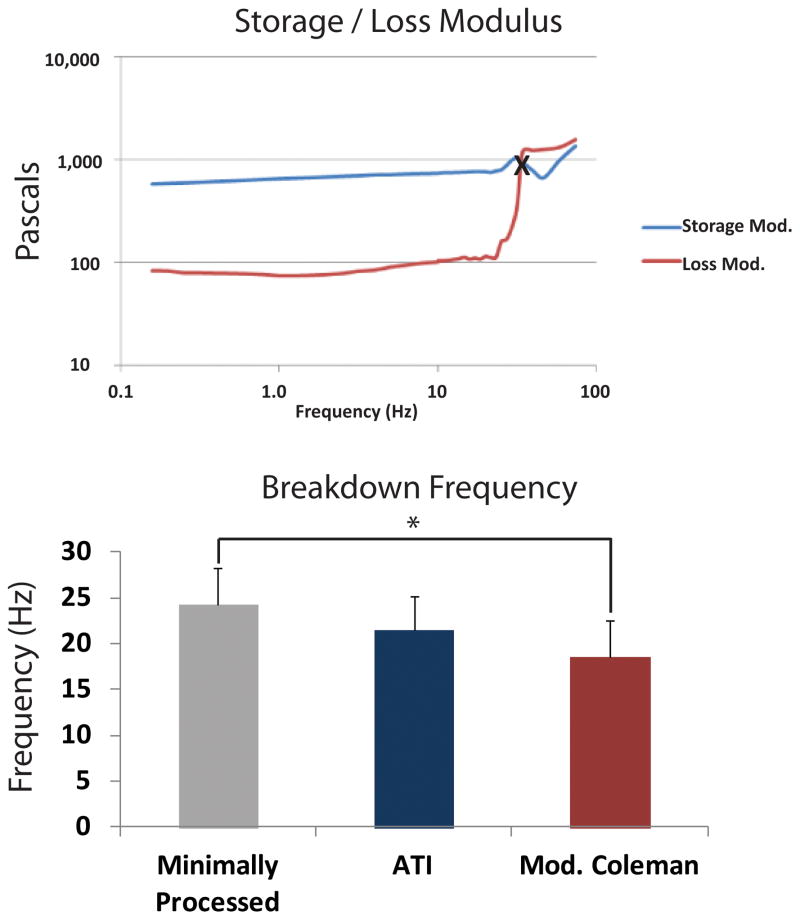
Figure 4.
Loss Modulus Testing. A) Representative chart of storage modulus (G′) (blue line) and loss modulus (G″) (red line) from minimally processed fat. Note the shear rate at the crossover point between the G′ and G″ data, marked by “X”, where the material behaves less solid-like and more liquid-like. B) Breakdown rate for fat from each group. The ATI group (blue bar) was similar to minimally processed fat (gray bar). Breakdown rate for modified Coleman (red bar) was significantly less than minimally processed fat (*p < 0.05).

