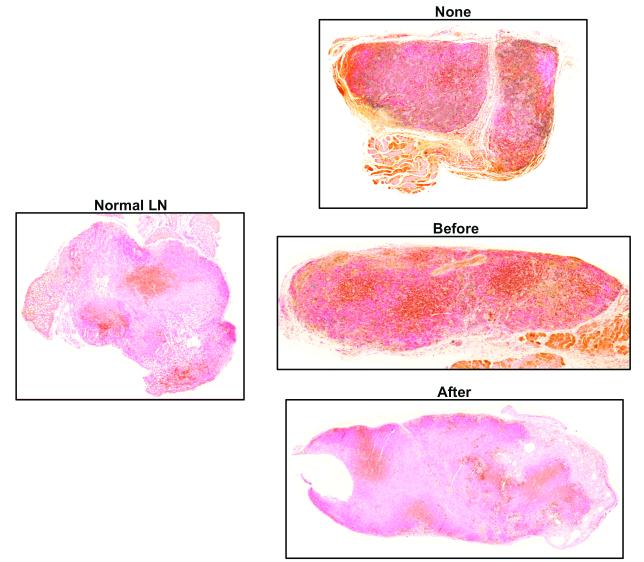
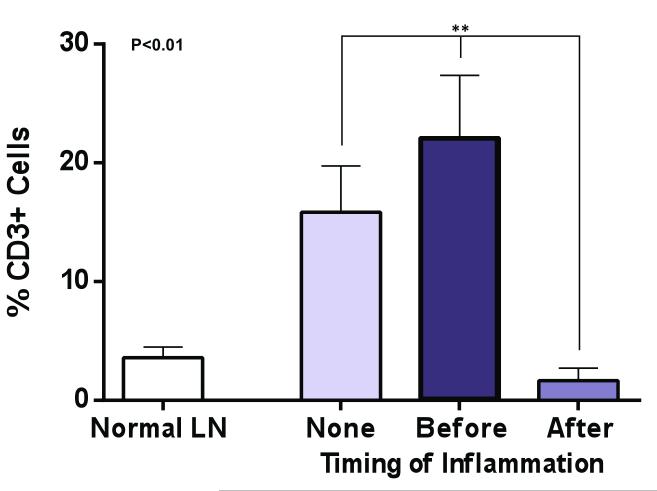
Figure 6. Sterile inflammation after lymph node transfer attenuates T cell infiltration.
A. Representative photomicrographs (5x magnification) of lymph nodes from various groups stained for CD3, a pan T cell marker. Note relative paucity and distribution of lymph node T cells in normal and inflammation after groups. In contrast, note relative increase staining for T cells in no inflammation or inflammation before transfer groups.
B. Quantification of T cells (percentage of T cells as a function of lymph node area). Note significant decrease in T cells in inflammation after transfer group as compared with no inflammation or inflammation before transfer groups.


