
Figure 2.
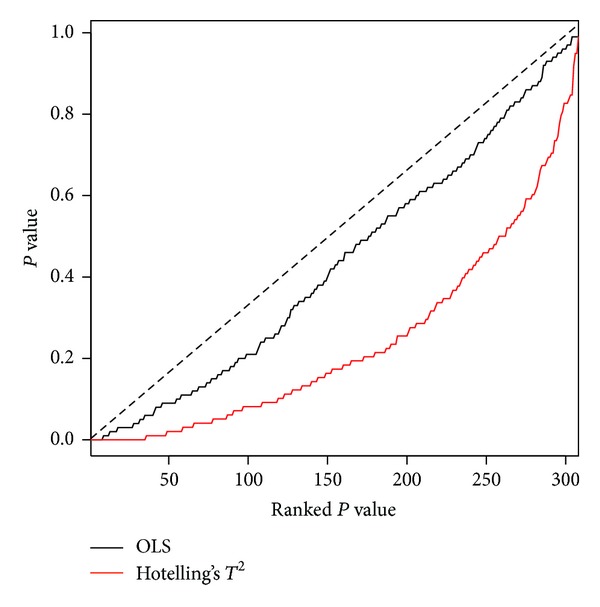
The GSA-plot for OLS test and Hotelling's T 2 test in P53 study. Both P values in OLS test (black line) and T 2 test (red line) are not close to the diagonal dash line. That means both tests could identify that several gene sets showed truly significant of the testing hypotheses.