
Figure 3.
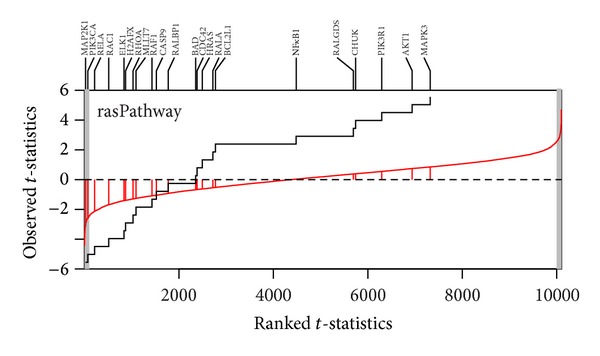
GST-plot for the gene set rasPathway in P53 dataset. The solid line is the empirical cumulative distribution function of the rank t-statistics for 10,100 genes in the array. The two-tailed shaded regions represent the t-statistics that had the P value less than 0.01. There are 22 tick marks above the plot which display the location of the P value of the genes from the gene set. The gene set shows underexpressed.