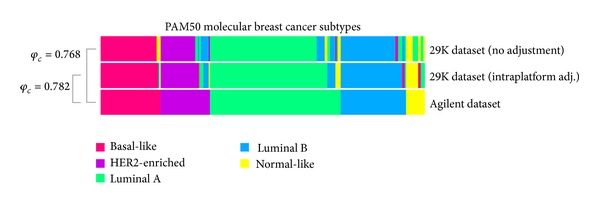
Figure 6.

Comparison of the molecular subtype classification methods PAM50. Between Agilent and 29K (unadjusted) datasets, 203 samples were found to be concordant and 40 discordant (Cramer's V association coefficient = 0.768). Between Agilent versus 29K (intraplatform adjusted) the classifications resulted in 208 concordant and 35 discordant subtype predictions (Cramer's V association coefficient = 0.782).
