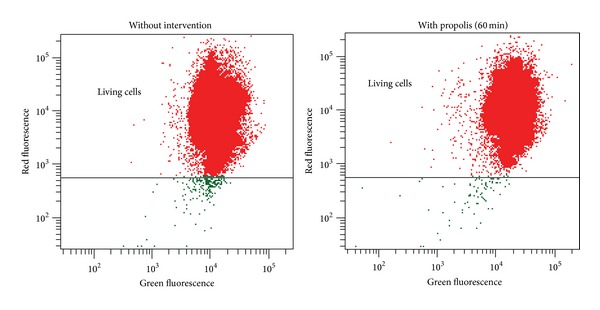
Figure 9.

Typical double fluorescence dot plots of flow cytometry analysis. Mitochondrial membrane potential was determined with MitoProbe JC-1 Assay Kit (Life Technologies). R-phycoerythrin = red fluorescence, normal cells; Alexa Fluor 488 dye = green fluorescence, reduced mitochondrial membrane potential.
