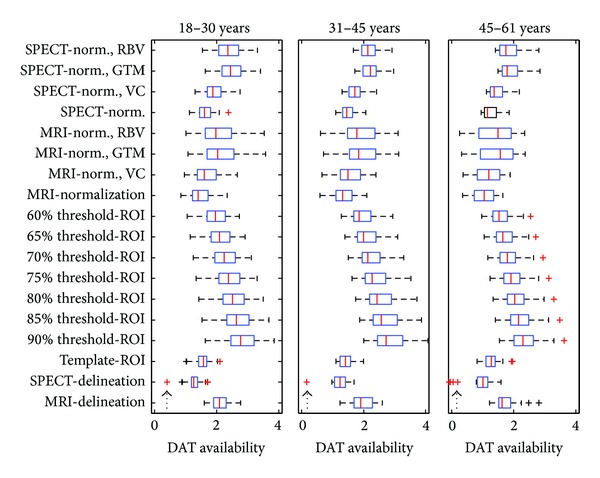
Figure 2.

Boxplots of the three groups: 18–30, 31–45, and 46–61 years old, in the 18 methods of determining striatal DAT availability. The high decline of DAT availability per decade determined by SPECT-delineation method (9.47%) was partly caused by outliners. There were six outliners (arrowheads) in the SPECT-delineation method. Instead of a two-sided normal distribution of the outliners, all the six outliners were less than the mean. It might thereby lead to a high decline of DAT availability per decade.
