Figure 4.

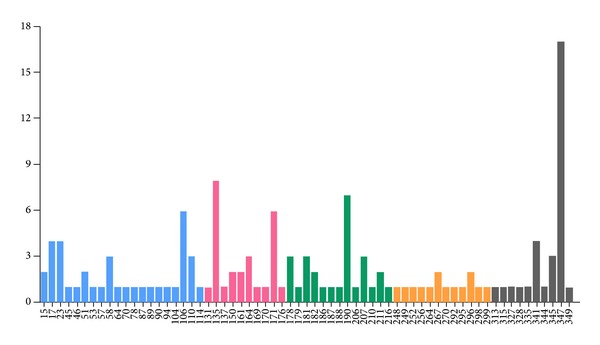
The mutation spectrum of RHO gene. The x-axis indicates the amino acid position and y-axis represents the number of reported mutations. Each color represents an exon: blue: exon 1; pink: exon 2; green: exon 3; orange: exon 4; grey: exon 5.

The mutation spectrum of RHO gene. The x-axis indicates the amino acid position and y-axis represents the number of reported mutations. Each color represents an exon: blue: exon 1; pink: exon 2; green: exon 3; orange: exon 4; grey: exon 5.