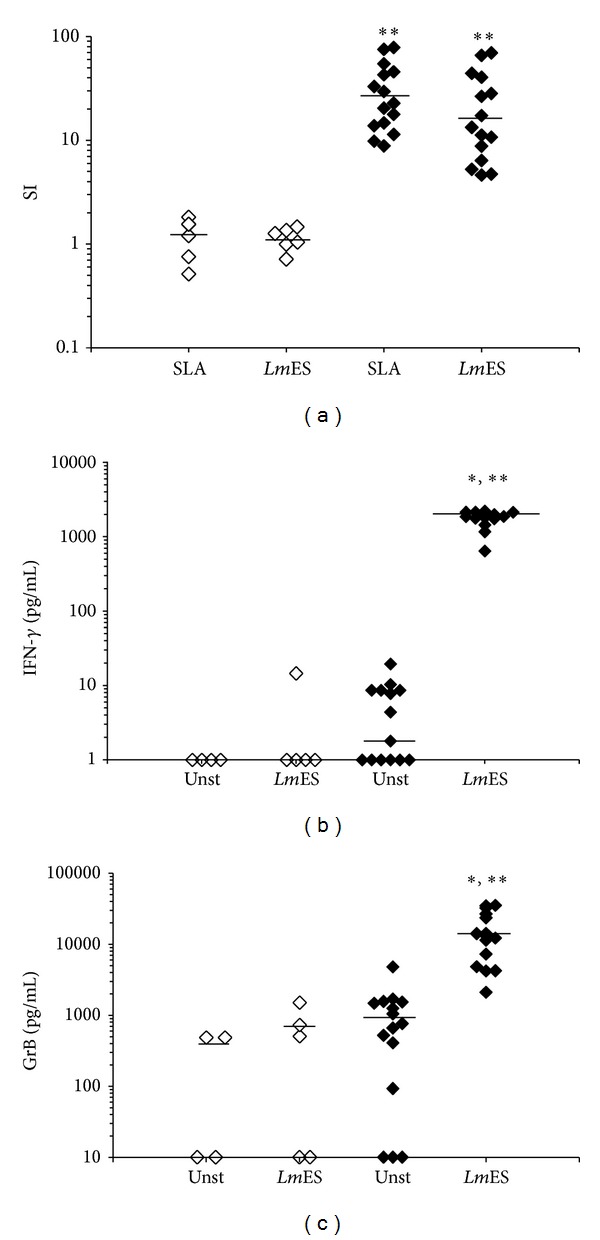
Figure 1.

PBMCs response induced by LmES. PBMCs from HZCL and HC were stimulated with LmES (10 μg/mL) or SLA (10 μg/mL) during 5 days. (a) Proliferation was assessed by [3H]-thymidine uptake. Results were expressed as an index of proliferation (SI) (mean counts of triplicates in antigen-stimulated cultures/mean counts of triplicates in unstimulated cultures) in all tested individuals. IFN-γ (b) and GrB (c) levels were evaluated in supernatants of cultures by ELISA tests at day 5. Results were expressed as cytokine concentrations in pg/mL. Bars represent median values. Statistical analysis: *P < 0.05, when comparing the stimulated cells to the unstimulated cells (Unst) and **P < 0.05, when comparing HZCL to HC.
