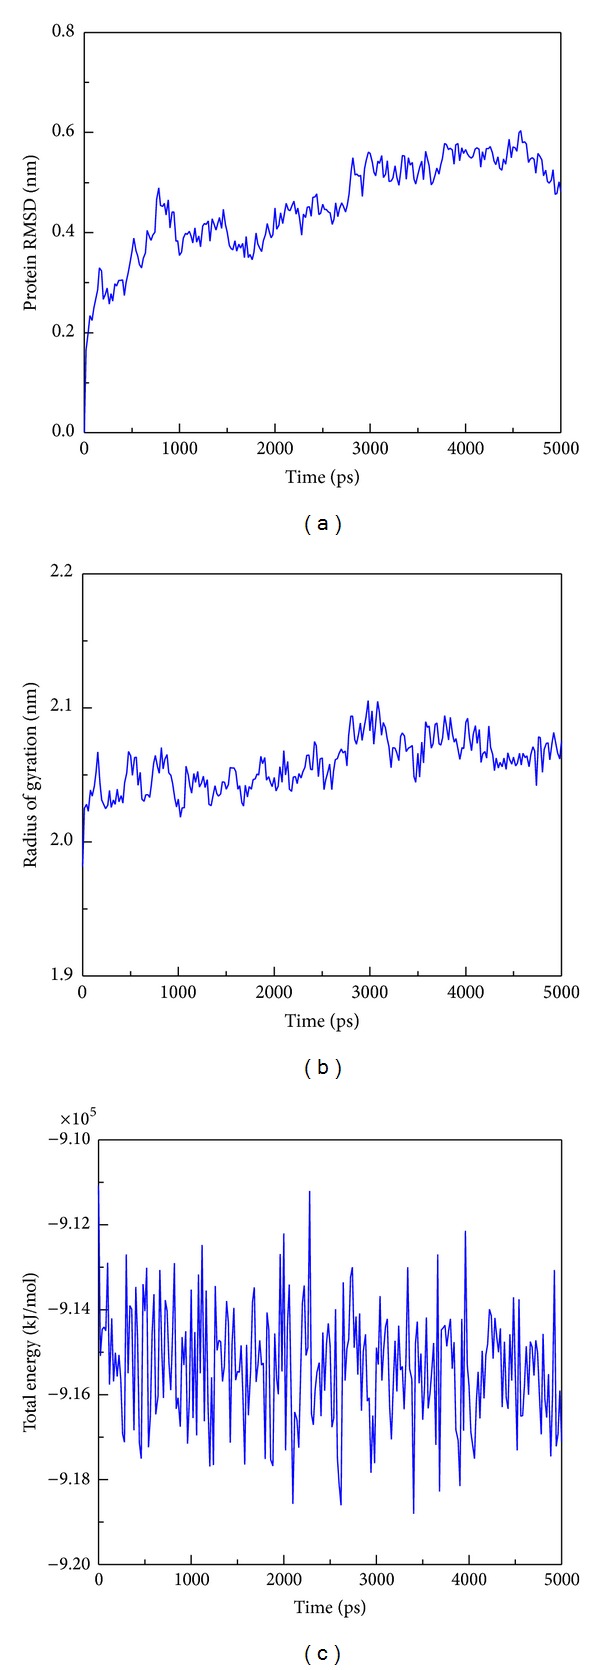
Figure 11.

The trajectory analysis of c-Jun and TFIIB during 5000 ps simulation times. (a) RMSD values of all atoms of c-Jun and TFIIB complex; (b) radius of gyration of c-Jun and TFIIB complex for identifying the compactness of protein structure; (c) total energy of all simulated systems of c-Jun and TFIIB complex; the total energy is sum of potential energy and kinetic energy.
