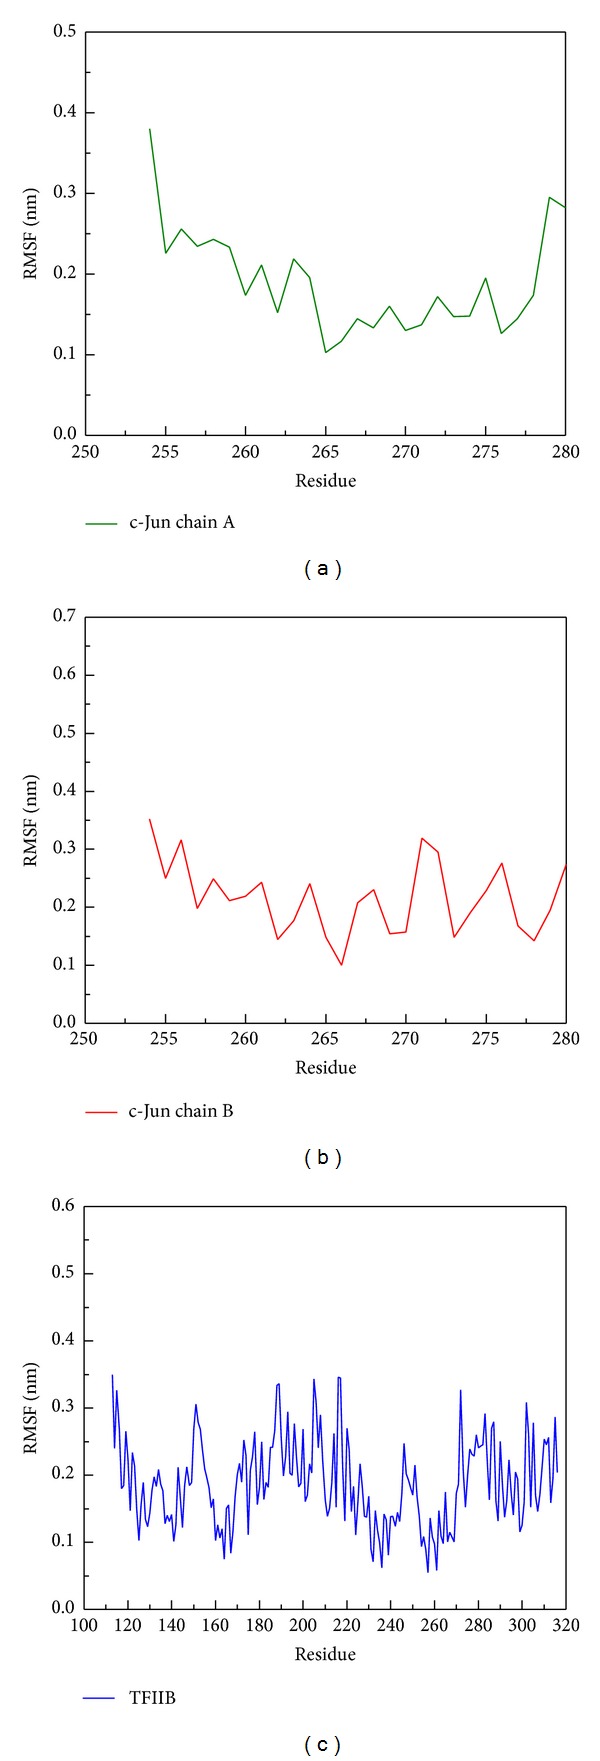
Figure 12.

RMSF analysis of protein resides on (a) chain A of c-Jun, (b) chain B of c-Jun, and (c) TFIIB during simulation time of 5000 ps. The residue index of chain A and chain B of c-Jun is from 254 to 280, and the residue index of TFIIB is from 113 to 316. The high values of RMSF indicated the high fluctuation of residue during all simulation times.
