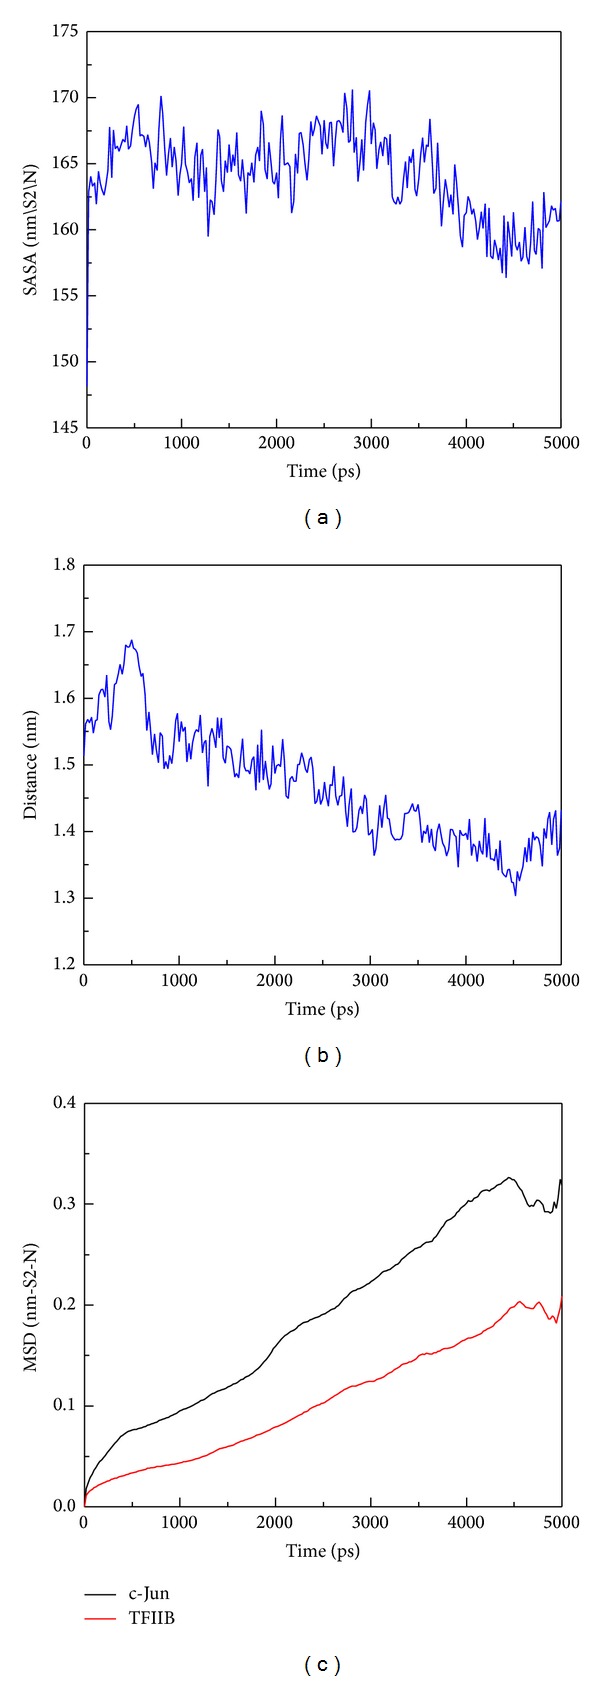
Figure 15.

The area of solvent and protein migration analyses during simulation time of 5000 ps. (a) The total solvent accessible surface area of c-Jun and TFIIB complex; (b) the distance between the centrals of masses of of c-Jun and TFIIB; (c) trajectory analysis of MSD of c-Jun and TFIIB. The high values of MSD indicated the longer distance of migration from the initial binding position.
