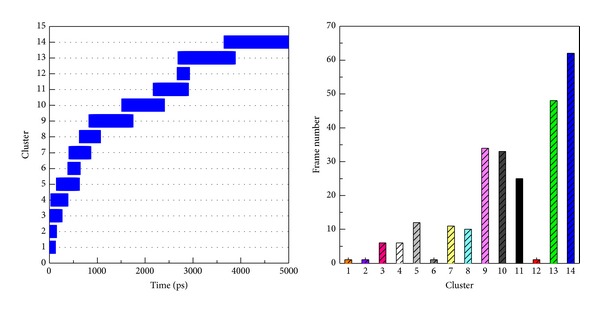
Figure 18.

Cluster analysis of all MD frames of c-Jun and TFIIB complex during simulation time of 5 ns for identifying representative structure. All MD frames were grouped into fourteen clusters by linkage method; the RMSD cut-off distance between each neighbor frame is 0.14 nm. The most predominant group is the cluster 14, which is displaced in the region of simulation time from 4000 to 5000 ps, and the MD frames in cluster 14 are the most number among all clusters. The middle frame of cluster 14 is displaced in simulation time of 4260 ps.
