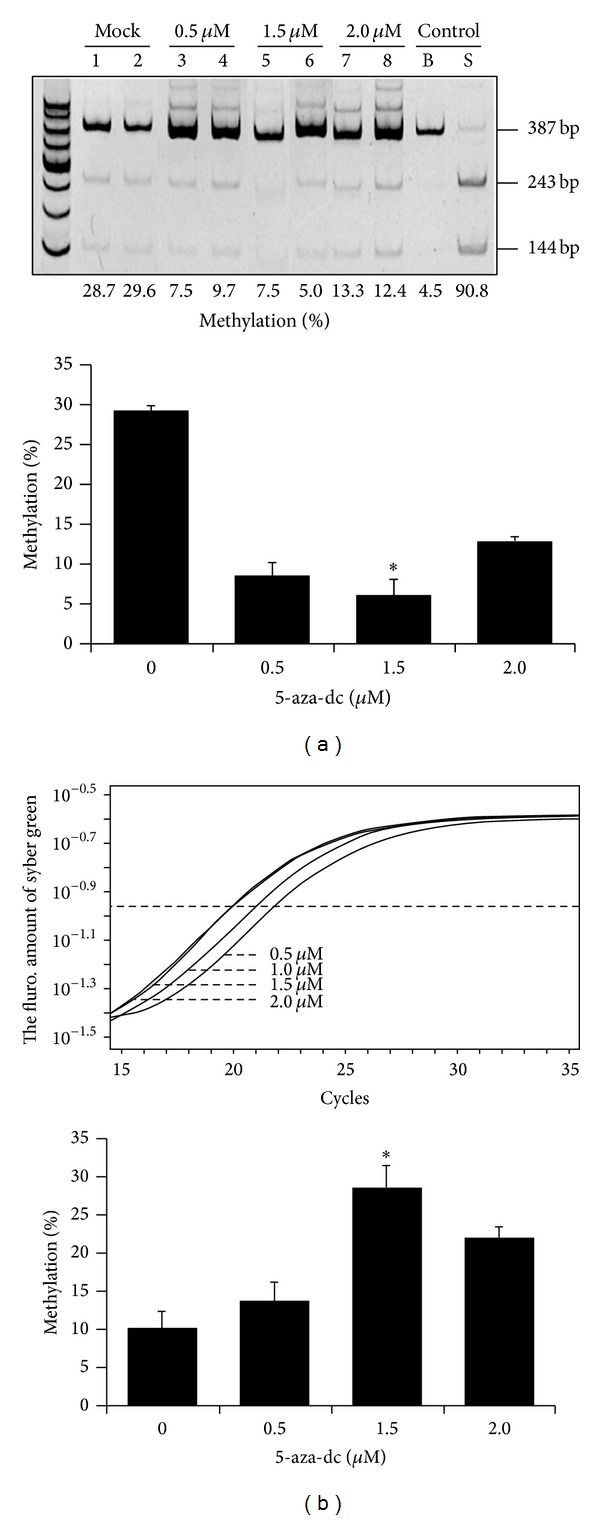
Figure 3.

OPN RNA expression and DNA methylation of 5-aza-dc treated pig fibroblast cell. (a) The schematic showed the methylation percentage and mRNA expression of OPN promoter in different concentrations 5-aza-dc. (b) The COBRA analysis of OPN promoter. Below the square is the methylation percentage of OPN promoter methylation.
