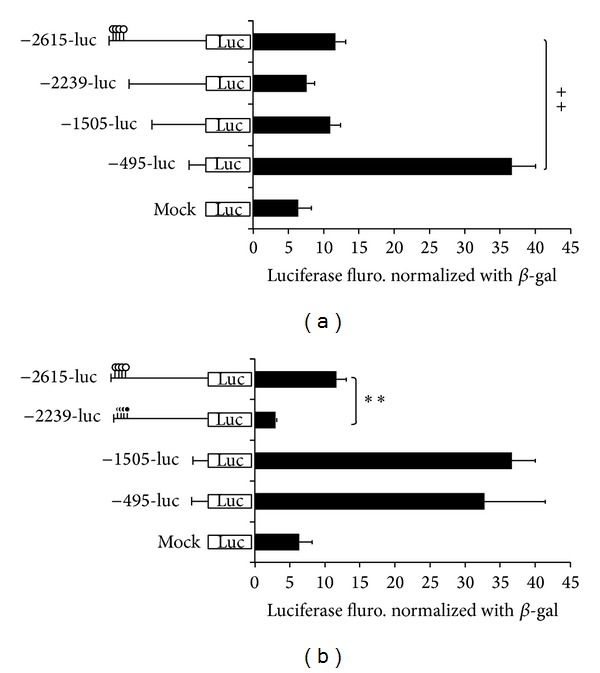
Figure 5.

Methylation and deletion analysis of OPN promoter in 293T cells. The match-like bar with black circle represents the methylation CpG site; white circle of match bar indicated the unmethylation CpG sites. PGL3 vector as standard; in 293T cell line; PGL3-enhance vector as negative control; cell lysate as the background; pCMV-b-gal as internal control. The relative value is adjusted by cell lysate; −495 M-luc indicated the methylation in PGL3 backbone with HhaI and HpaII methyltransferase. (**P < 0.01); −2615-luc and −2615 M-luc: n = 3; −495-luc and −495 M-luc: n = 4. The experiments were repeated three times and the results were analyzed and presented as the mean ± SE.
