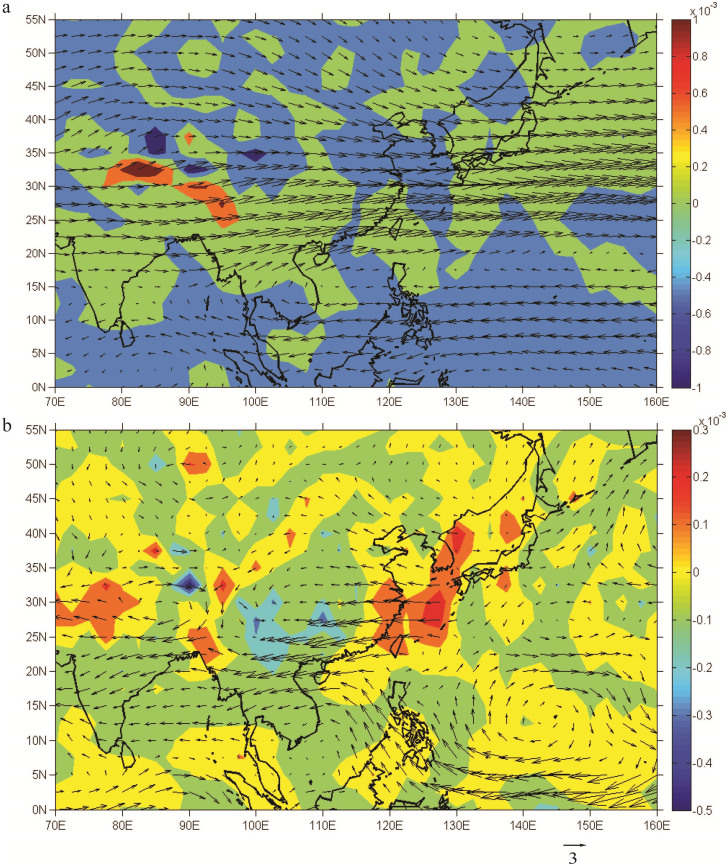
Figure 3. The vertically integrated mean water vapor transport over our study areas in the dry season (Oct.–May).
(a), the vertically integrated mean water vapor transport for 1979–1993. (b), the difference of the vertically integrated mean water vapor transport between 1979–1993 and 1998–2012. The arrow key is standing for the water vapor flux and the color shading is representing the water vapor flux divergence. The unit is g/(cm·hPa·s) for the water vapor flux and g/(cm2·hPa·s) for the water vapor flux divergence. The turning time chosen for the comparison is the shift time of the SST over the four seas, i.e., 1993–1998 in the dry season. The maps in the figure were created by G.T. using Matlab 2011b.

