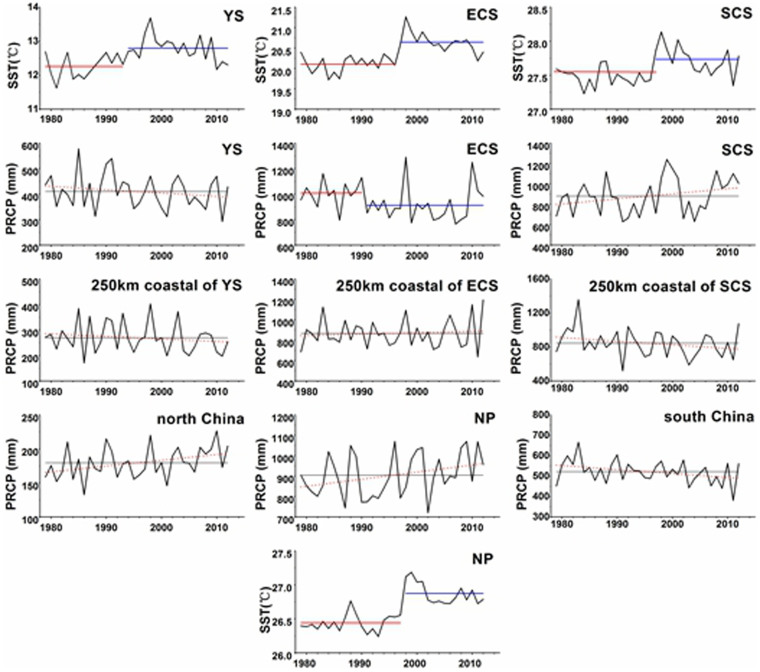
Figure 5. Comparison between the dry season (Oct.–May) precipitation and SST over Yellow Sea, East China Sea, South China Sea, the 250 km coastal areas adjoining to three seas, the south China, the north China, and Northwest Pacific during 1979–2012.
The red dot line stands for the linear trend of the precipitation. The red line in the figure indicates the mean of the SST or precipitation before the shift tested by the homogeneity test with the Excel 2010, while the blue line indicates the means of the SST or precipitation after the shift.

