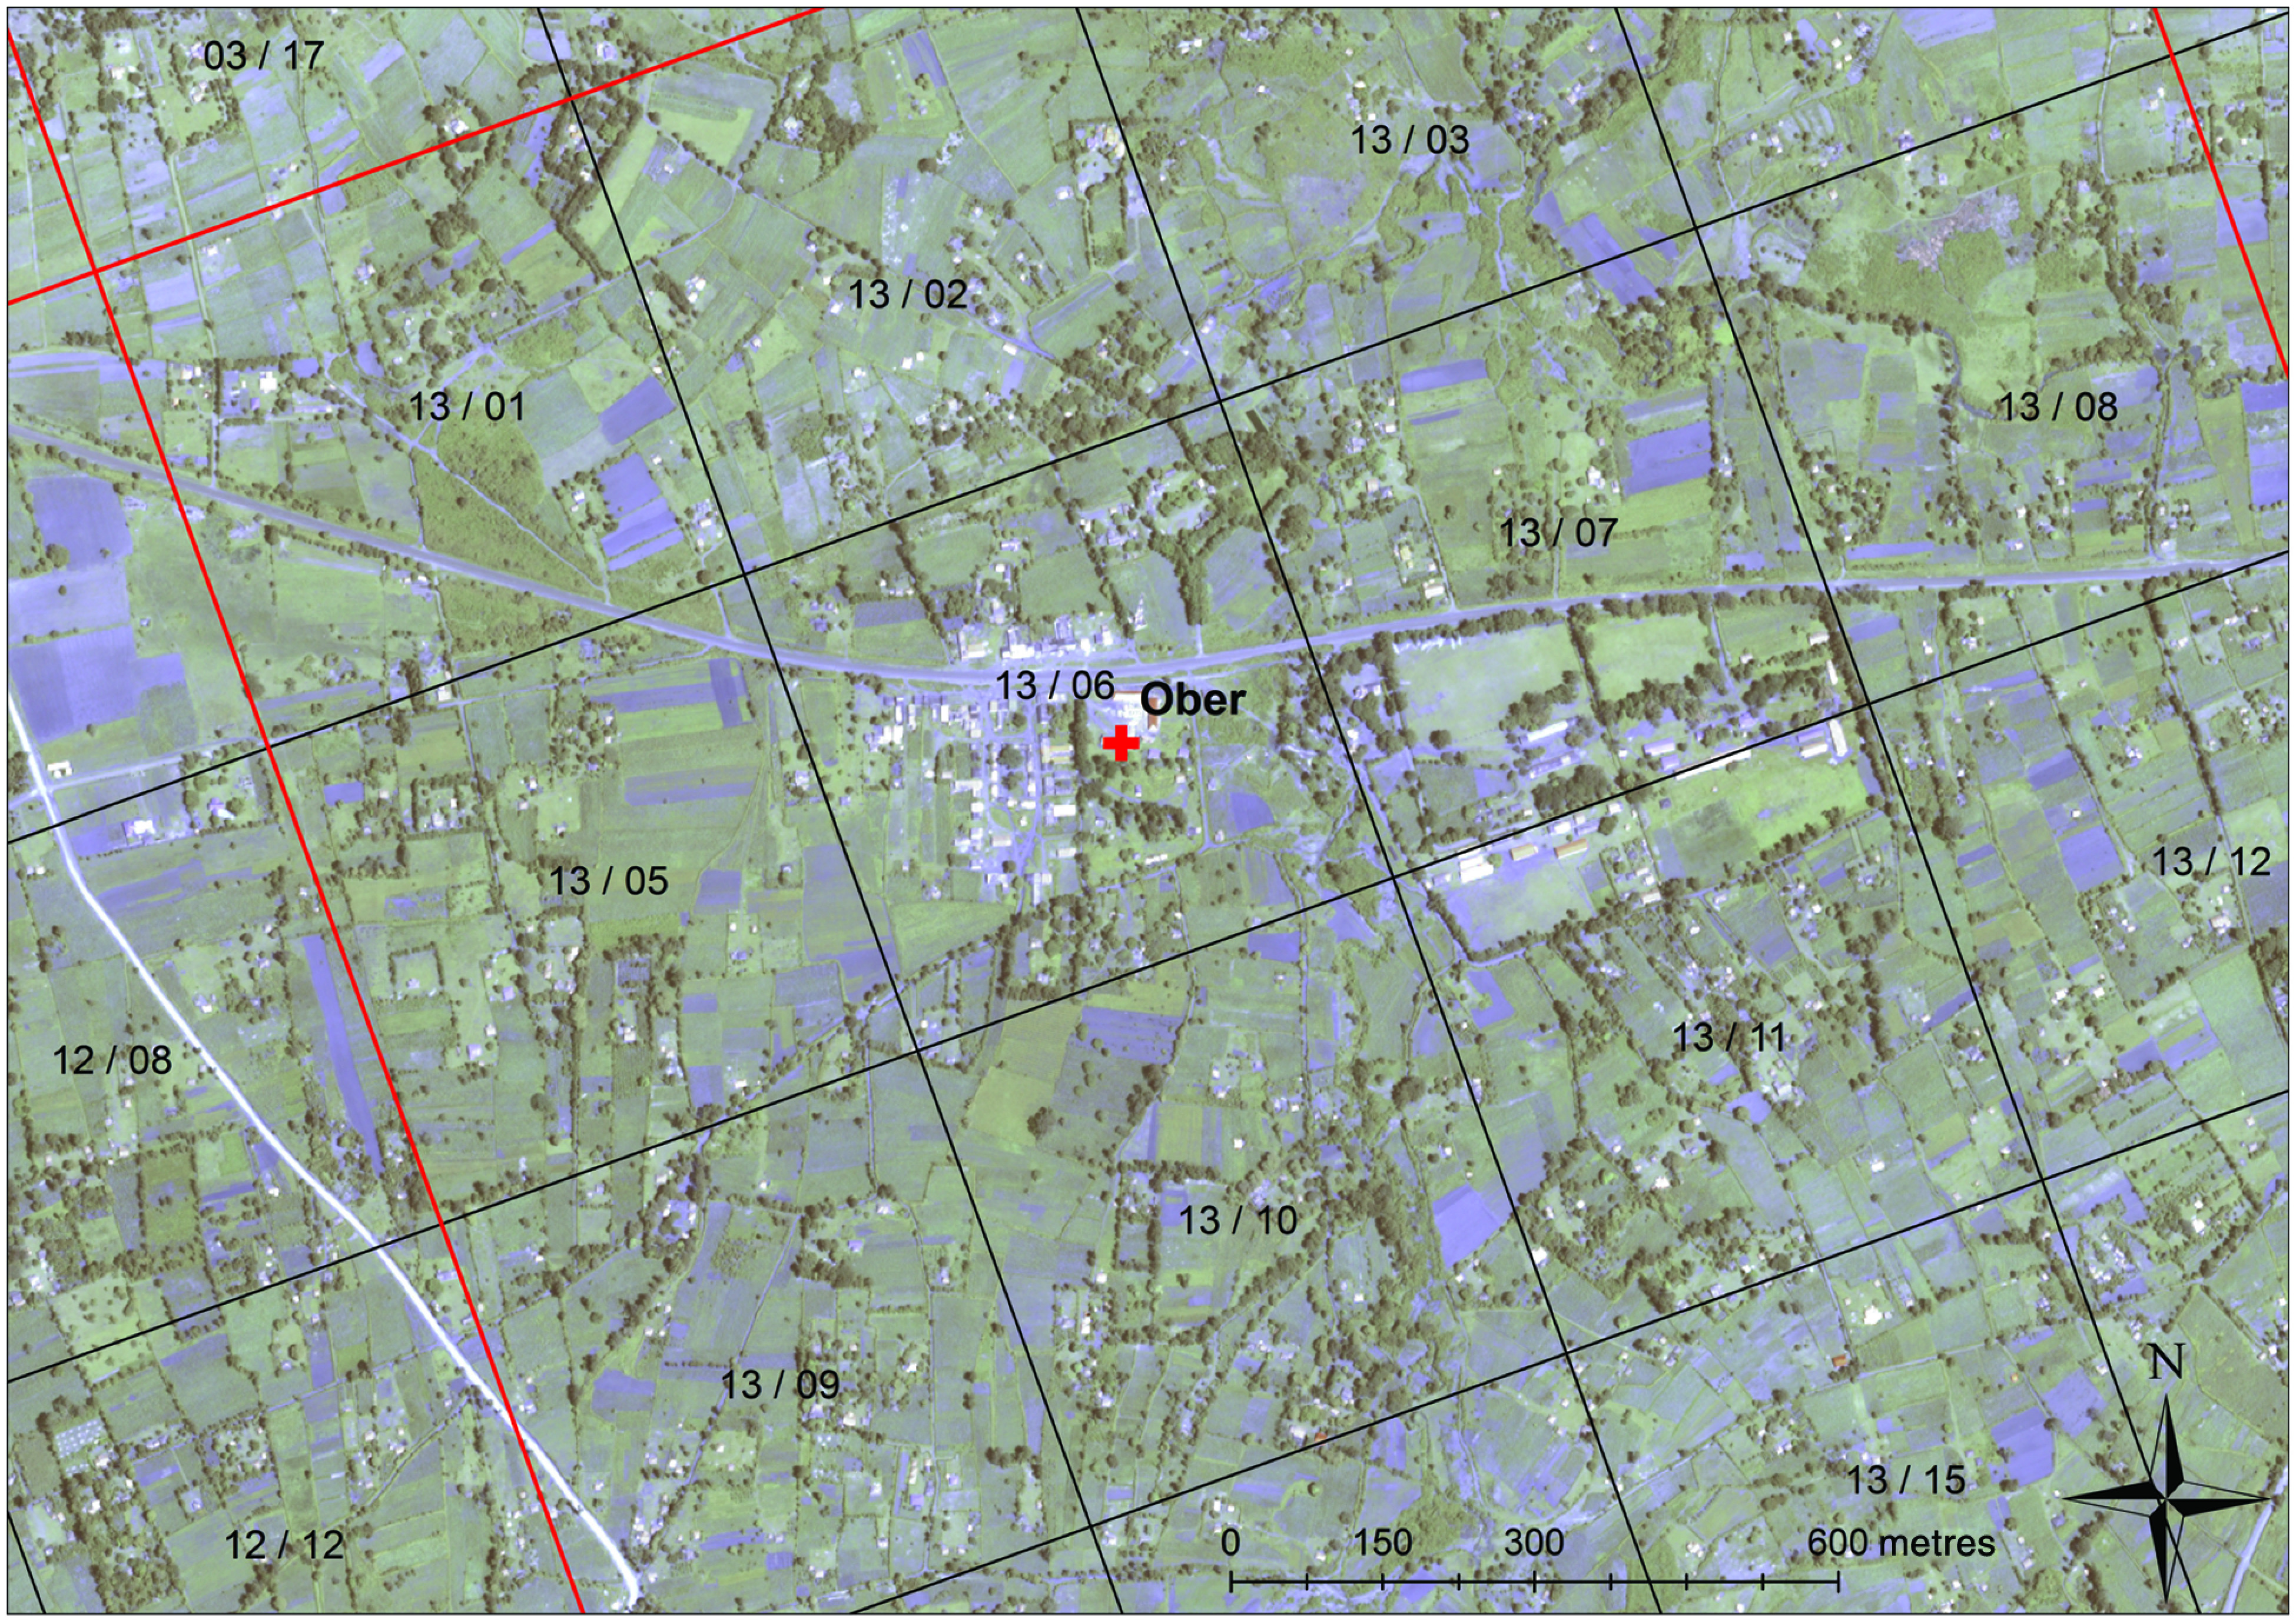
Fig. 2.

Participatory mapping example showing the grid of blocks and cells that were overlain on satellite imagery. The red lines outline the block and block numbers are shown. The cells are outlined by the black lines within each block and are counted from 1 to 20 starting with the upper left corner and counting from left to right (i.e. 13/01 to 13/20).
