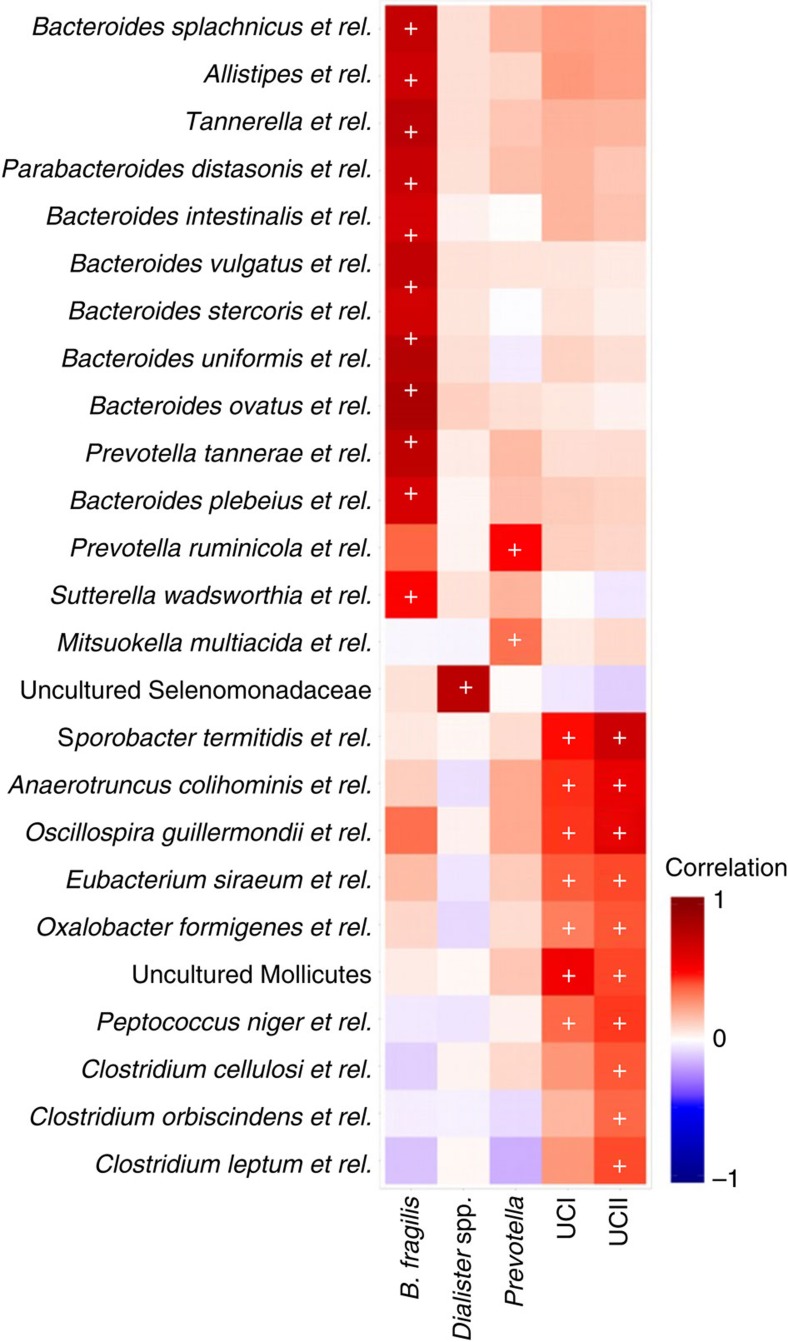
Figure 7. Covariation between the bimodal groups and other taxa.
Summary of correlations between the bimodal groups (columns) and the 124 other genus-like groups targeted by the HITChip microarray; significant correlations with 25 groups (rows; P<0.05; |r|>0.25; Pearson correlation) were consistently observed in independent sample sets analysed using two different DNA extraction methods (mechanical lysis; n=401 and enzymatic lysis-based method; n=287), and in 100 bootstrap data sets sampled from the overall data collection (n=1,006). The remaining 99 groups that did not show significant correlations have been removed for clarity. The 32 correlations that were found to be consistently significant in all tests are indicated by ‘+’. Shading indicates Pearson correlation between the taxa across the 1,006 western adults.

