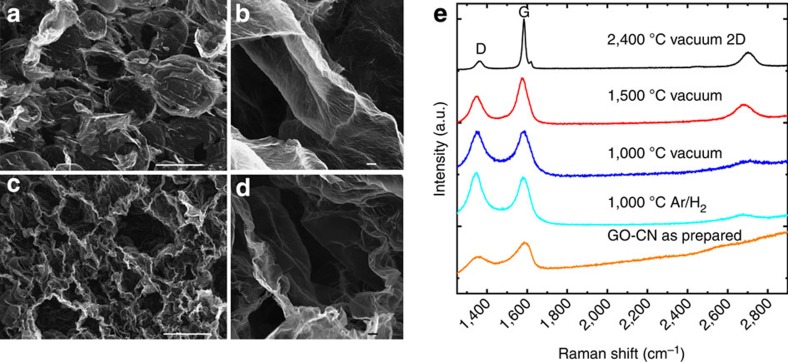
Figure 4. Effect of the thermal treatment temperature and atmosphere on rGO-CNs microstructure and crystallinity.
SEM images of rGO-CNs thermally treated in a graphite furnace under high vacuum at: 1,000 °C (a,b) (1.4 mg cm−3 density) and 2,400 °C (c,d) (7.2 mg cm−3 density). The density of as-prepared GO-CNs (0.65 wt% GO and 0.3 wt% additives (PVA:sucrose in 1:1 wt%) in suspension) before thermal treatment is 2.9–3.3 mg cm−3. rGO-CNs reduced at 2,400 °C present highly wrinkled cell walls (c,d) as a result of the high degree of shrinkage (87%) during thermal treatment. (e) Raman spectra of the CMG-CNs as prepared and under different thermal treatments in Ar/H2 atmosphere or in vacuum in a graphite furnace. The Raman spectrums were obtained using 514 nm laser. The letter ‘D’ and ‘G’ stand for two characteristic Raman active modes for graphene and other carbon allotropes and the D/G ratio is a measure of the density of defects present in the carbon material28. Scale bars, 100 μm (a–c) and 2 μm (b–d). a.u., arbitrary unit.

