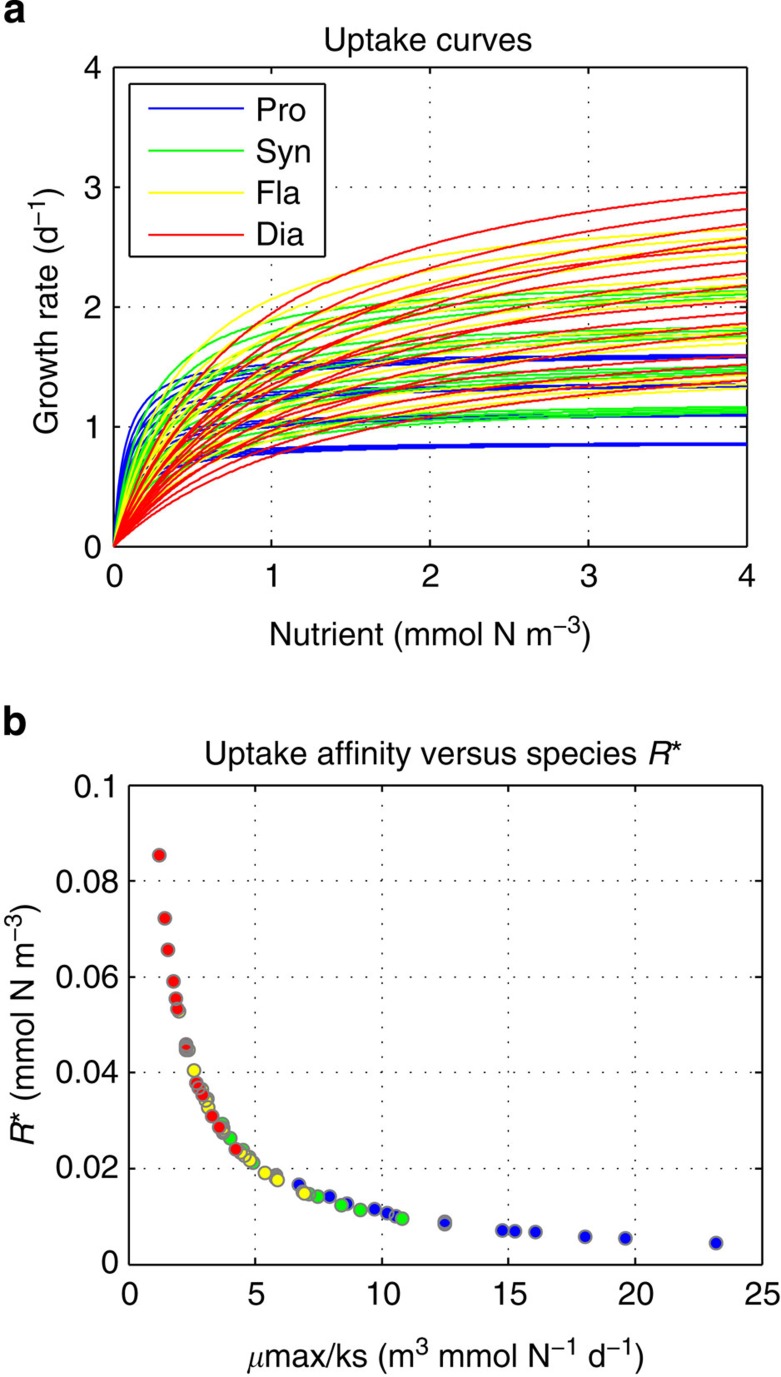
Figure 8. Phytoplankton species traits that define their nutrient niches and competitive abilities.
(a) Species nutrient uptake curves as a function of dissolved inorganic nitrogen (mmol N m−3); (b) species subsistence nutrient concentration at equilibrium (R*) versus their nutrient uptake affinity (μmax/ks).

