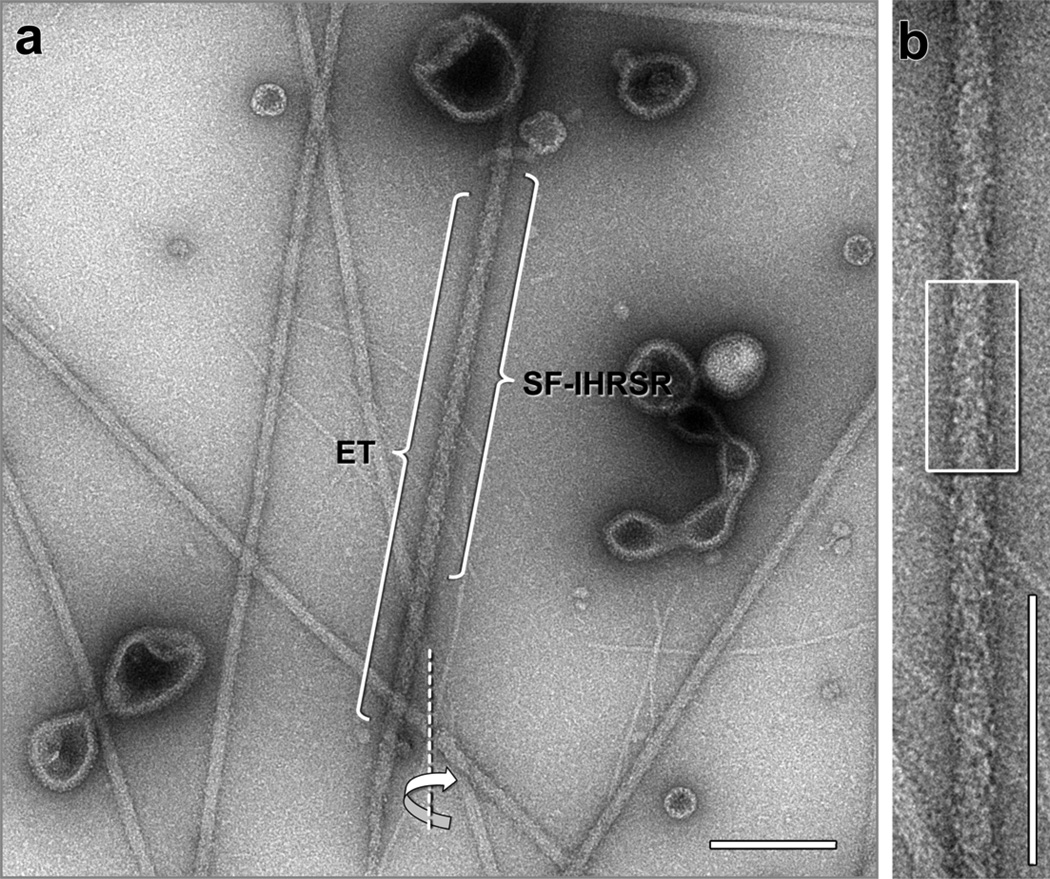
Figure 1.
(a) Electron micrograph showing several negatively stained thick filaments from tarantula muscle. An electron tomographic tilt series was recorded from the thick filament labeled “ET” along a tilt axis (dotted line). The tip of this filament is at the bottom and its bare zone is towards the top (not shown). The image shown corresponds to the 0° tilt image of the tomogram. A single filament IHRSR (SF-IHRSR) 3D-reconstruction was calculated from a subset of the tilt series of the same filament (labeled SF-IHRSR), enlarged in (b). Alternatively, a tomographic 3D-reconstruction was calculated for this thick filament using the tilt series images (Fig. 6a). The box in “b” also corresponds to the enlarged view shown in the Fig. 6a (bracket), Bare zone at the top. Bars 200 nm.

