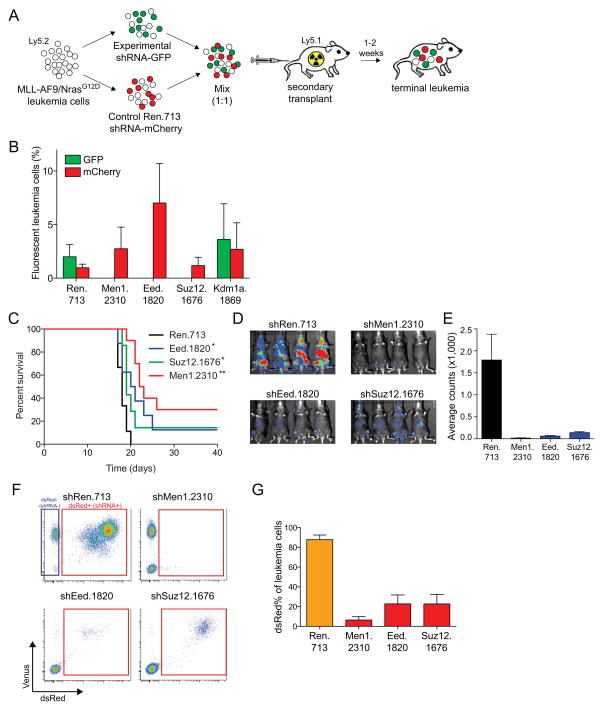
Figure 2. Suppression of Eed or Suz12 impairs leukemia progression in vivo.
(A) Schematic of two-color competition assay measuring impact of LMN-shRNAs on leukemia expansion in vivo. MLL-AF9;NrasG12D leukemia cultures were transduced with either experimental shRNAs from the LMN vector, or with a Ren.713 control shRNA expressed from LMN-mCherry. Experimental and control cultures were mixed at 1:1 GFP:mCherry ratio followed by transplantation of 1 × 10⁶ cells into secondary recipients on day 2 post-infection, prior to any depletion of GFP+ cells in vitro. Upon reaching terminal disease state (~15 days), as indicated by moribund appearance and whole-body bioluminescent signal, mice were sacrificed and bone marrow was collected for flow cytometry evaluation. Gating was performed on donor-derived leukemia populations (CD45.2+) and the ratio of GFP:mCherry was measured using a LSRII flow cytometer. (B) Percentage of GFP and mCherry positivity within donor-derived leukemia cells (CD45.2+) derived from bone marrow at the terminal disease endpoint (~15 days following transplant). Each shRNA group included 5 mice. (C–D) Tet-on competent MLL-AF9;NrasG12D leukemia cultures were retrovirally transduced with TRPMV-Neo constructs (pSIN-TRE-dsRed-miR30-shRNA-PGK-Venus-IRES-NeoR) followed by G418 selection (1 mg/ml for 6 days). Transduced cells were then transplanted into secondary recipient animals, followed by initiation of doxycycline administration after 1–2 days. Mice were monitored thereafter by bioluminescent imaging (IVIS Spectrum system; Caliper LifeSciences) and for differences in overall survival. Bone marrow from leukemic mice at terminal disease stage, was analyzed by flow cytometry for the percentage of dsRed+/shRNA+ cells in donor-derived (CD45.2+) leukemia populations. Each shRNA group contained 8–10 mice. (C) Kaplan-Meier survival curves of mice transplanted with Tet-On competent MLL-AF9;NrasG12D leukemia cells transduced with the indicted shRNAs in the TRMPV-Neo vector (32). Statistical significance was calculated by using log-rank test comparing to shRen control group; *, P<0.05; **,P<0.0001. (D) Representative bioluminescent imaging of leukemia disease burden at day 15 post-transplant. (E) Quantification of bioluminescent imaging shown in (D). Mean values were calculated from 4 replicate mice. (F) Flow cytometry analysis of donor-derived (Cd45.2+) leukemia cells in terminally-diseased mice from (C). The gate shown includes shRNA+/dsRed+ cells. Representative plots are shown. (G) Quantitation of results shown in (F) (n = 6 to n = 9). All error bars shown represent s.e.m. All mouse experiments included in this work were approved by The Cold Spring Harbor Animal Care and Use Committee.

