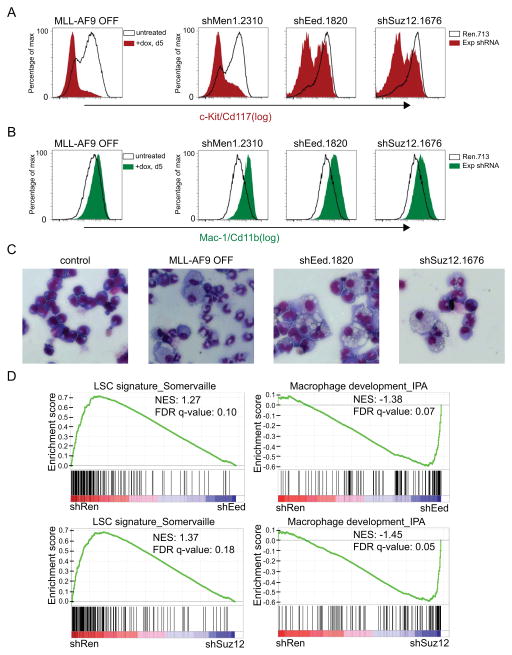
Figure 3. Suppression of Eed or Suz12 results in differentiation of MLL-AF9;NrasG12D leukemia cells.
(A, B) Flow cytometry analysis of cell surface levels of c-Kit/Cd117 and Mac-1/Cd11b. MLL-AF9 was suppressed as a positive control using a TET-off system (35), following 5 days of 1 ug/ml doxycycline treatment. Untreated TET-off leukemia cells were used a negative control. Men1, Eed, and Suz12 LMN-shRNAs were transduced into MLL-AF9;NrasG12D leukemia cultures, with cell-surface staining and flow-cytometry analysis performed on day 7 post-infection. Since the average infection efficiency was ~ 20%, shRNA+/GFP+ cells were compared to shRNA-/GFP- within each culture as an internal negative control. (C) Light microscopy of May–Grunwald/Giemsa-stained MLL-AF9;NrasG12D leukemia cells under the same experimental condition used in (A, B), except G418 was administered to LMN-transduced cells following infection to select for shRNA+/GFP+ cells. Imaging was performed using X40 objective. Representative images of three biological replicates are shown. (D) GSEA of microarray data obtained from leukemia cells transduced with Eed and Suz12 LMN-shRNAs, 5 days post-infection/G418 selection. NES, normalized enrichment score; FDR q-val, false discovery rate q-value. All error bars shown represent s.e.m.

