
Figure 9.
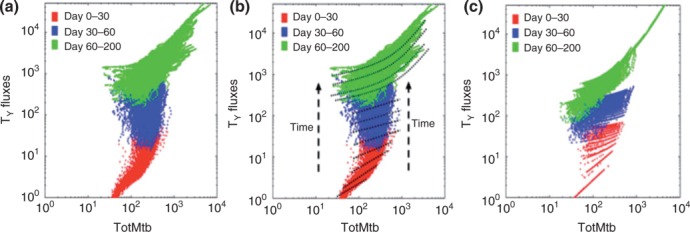
Comparisons of Tγ cell fluxes across different model resolutions. T cells that make the cytokine IFN-γ (Tγ) are shown on the y-axis. The x-axis represents total bacteria count. Each plot displays a total of 900 × 200 points. Each point is the combination of total bacteria count and Tγ cell fluxes at a certain day during a simulated 200-day infection. Different colors correspond to different time intervals. (a) Results using the fine-grained version of T cell recruitment (GRANSIM-LN). (b) The data from (a) with examples of linear and quadratic functions superimposed to fit the data. (c) Results using the improved coarse-grained model in which the fine-grained fluxes in (a) are approximated using the linear and quadratic functions illustrated in (b). For days 0–60, we use linear approximations. For days 60–200 we use quadratic functions. We fit simulated Tγ and TC fluxes separately. In order to cross-validate with fine-grained LN outcome distributions, we truncated the approximations at a certain level of total bacteria, below which the flux becomes 0. For example after day 30, if bacteria <35, fluxes are set to 0.