Figure 3.

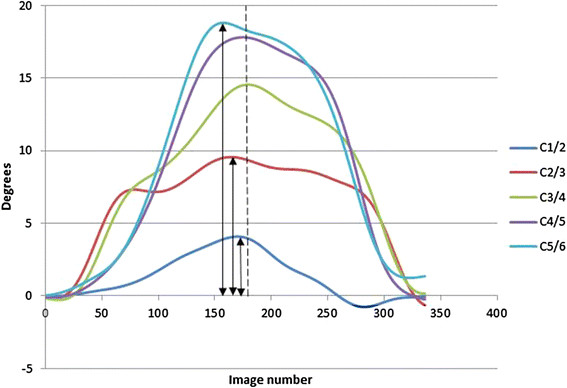
Examples of IV-RoM compared to global motion. IV-RoMs at individual levels are shown as peaks of coloured lines and the end of global motion as a dotted line.

Examples of IV-RoM compared to global motion. IV-RoMs at individual levels are shown as peaks of coloured lines and the end of global motion as a dotted line.