Figure 5.

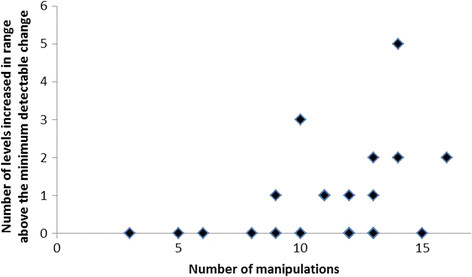
Manipulations received by levels that increased in range. Scatterplot showing the number of manipulations received against the number of intervertebral levels that increased their range above MDC. * = Spearman rank correlation.

Manipulations received by levels that increased in range. Scatterplot showing the number of manipulations received against the number of intervertebral levels that increased their range above MDC. * = Spearman rank correlation.