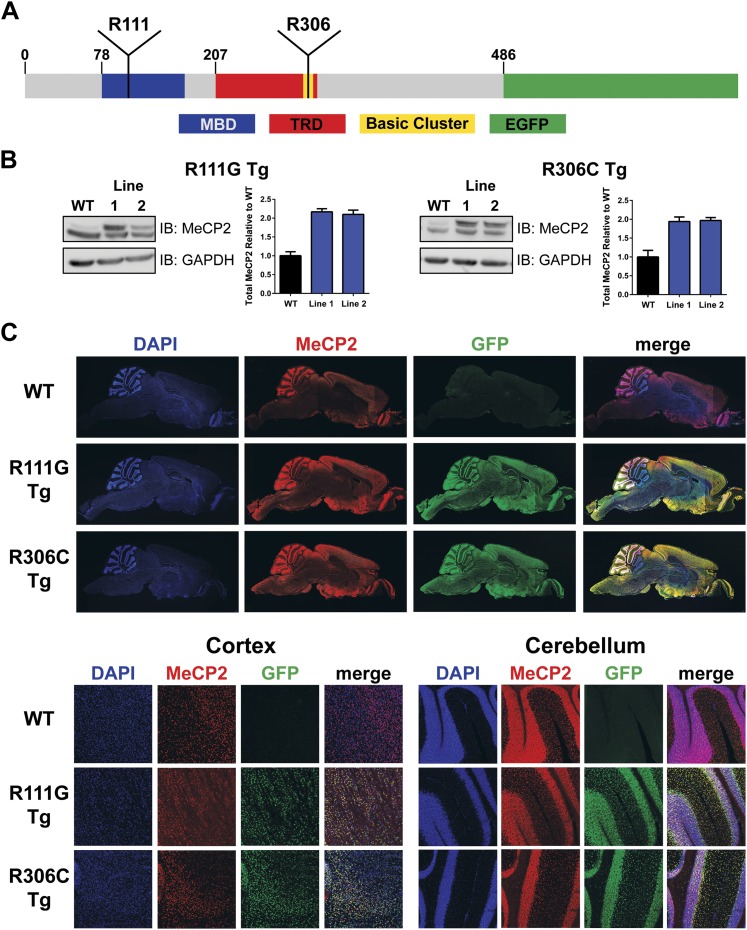
Figure 1. Generation of transgenic lines.
(A) Schematic representation of MeCP2-EGFP fusion protein, showing the methyl-CpG binding domain (MBD, blue), transcriptional repression domain (TRD, red), a cluster of basic amino acids (yellow), and enhanced green fluorescent protein (EGFP, green). The location of the residues arginine 111 (R111) and arginine 306 (R306) are shown. (B) Western blot analyses of whole brain lysates show that two independent lines of MeCP2-R111G and MeCP2-R306C express the transgene at levels similar to endogenous MeCP2 as judged by the similar intensities of WT and transgenic bands using an anti-MeCP2 antibody. Quantification of total MeCP2 is shown to the right for each mutant. An anti-GAPDH antibody was used to detect GAPDH as a loading control. (C) Immunofluorescence (IF) of midsagittal brain sections (2 months, upper panel) shows that the expression pattern of the transgenes throughout the whole brain (anti-GFP antibody, green) parallels that of endogenous MeCP2 (anti-MeCP2 antibody, red). Colocalization is visible as yellow in the merged image, with 4',6-diamidino-2-phenylindole (DAPI, blue) as a general marker for the nucleus. Closer examination of the cortex and cerebellum (lower panel) mirrors this.

