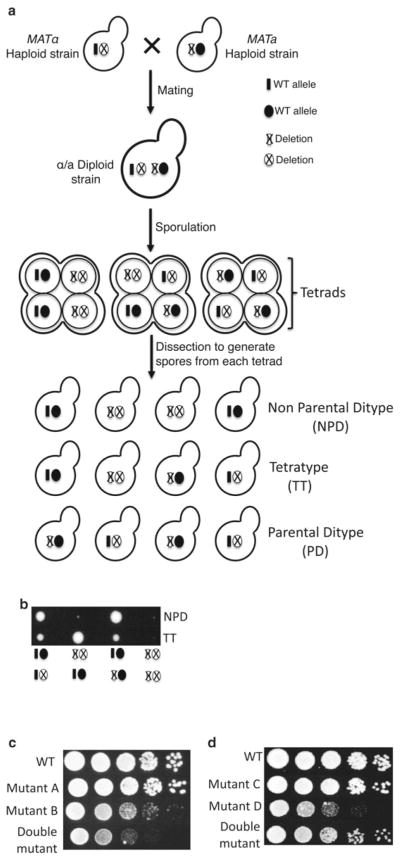
Fig. 1.
Genetic interaction analysis in the yeast Saccharomyces cerevisiae. (a) Schematic diagram shows how classical genetic interaction studies are performed between yeast mutant strains. The first is the mating of two haploid strains in which the gene of interest is deleted and replaced by a selectable marker. The mating will generate a heterozygous diploid strain, and sporulation of the diploid strain will generate haploid spores clustered in a 4-spore ascus. Microdissection of each tetrad generates four haploid cells that can grow to form colonies and can be genotyped to identify the combination of WT and mutant alleles. Segregation of mutant alleles leads to three classes of tetrads: nonparental ditype (NPD), tetratype (TT), and parental ditype (PD). (b) Representative picture of a tetrad dissection plate. Each row represents a tetrad, which shows growth from each spore. The genotype of each spore is depicted below the panel. The genotype of the spores can be determined by growing the cells under selective conditions to identify the presence of selectable markers associated with the mutations (e.g., geneticin-resistance). Alternatively, genomic DNA can be isolated from the cells, and PCR can be performed using primers that specifically identify the mutations of interest. (c and d) Show representative pictures of a dilution growth assay comparing WT, single mutants, and double mutants. Cells were grown at 30 °C to the same OD600 ~0.5 and then tenfold serial dilutions were spotted on YPD plates. Panel (c) shows the synthetic growth defect phenotype of double mutant cells (bottom row), which grow more slowly than either of the single mutants (middle two rows ). The dilution assay in panel (d) shows the suppressor phenotype of the double mutant cells (bottom row ), which grow better than single mutants (middle two rows)

