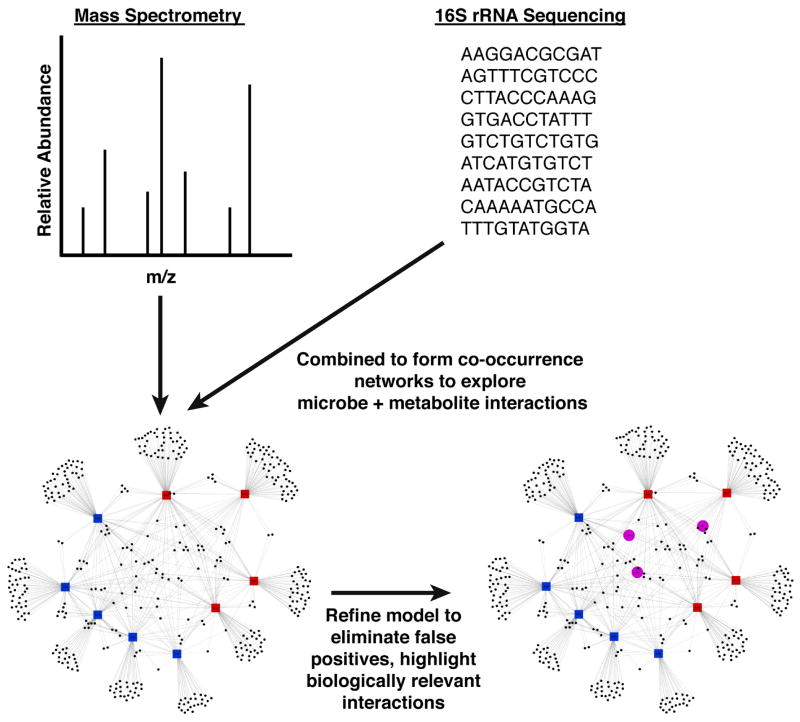
Figure 2. Exploring the Interactions Between Metabolomics and the Microbiome.
Both metabolomics and high-throughput sequencing produce a wealth of information. Visualizing the interactions between these highly multivariate datasets is important for elucidating relationships. In this example tripartite network, the large blue nodes represent samples, which are connected to red diamonds (metabolites) with red edges, and connected to black circles (OTUs) with black lines. The closer an OTU node or a metabolite node is to a sample node, the larger the relative abundance of that metabolite or that OTU in that sample. Therefore, OTUs and metabolites that are close together in the network tend to be found in the same samples (and this suggests, but does not conclusively prove, that the metabolite may be produced by that OTU). The tripartite network also demonstrates which metabolites and OTUs are shared by samples, and which metabolites and OTUs are unique to a given sample. As discussed in this review, methods are being developed to help separate out biologically important associations from amongst many statistically significant ones. Once identified, we can visualize how biologically important metabolites are controlled by the interaction between host and microbiome.

