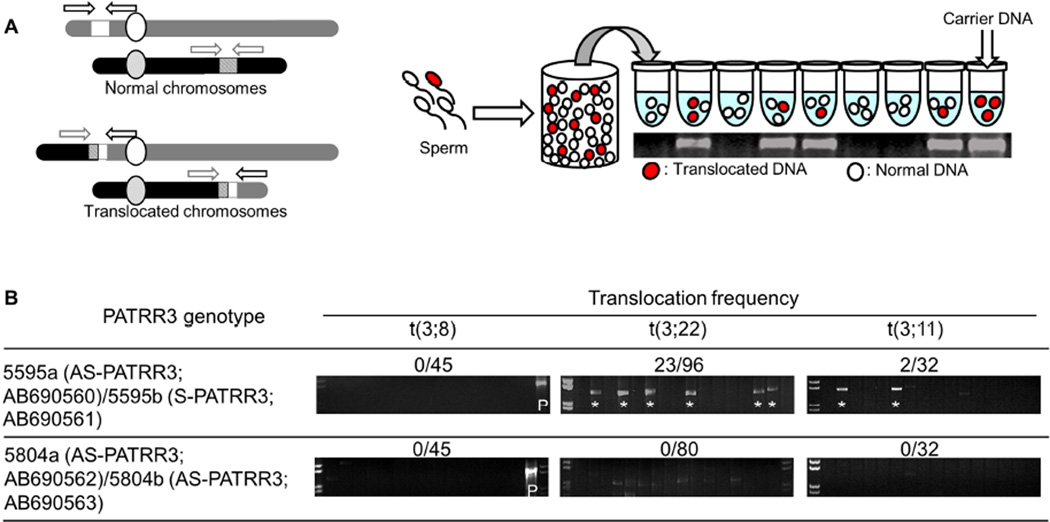
Figure 3. Detection of de novo PATRR3 involved translocations.
(A) Strategy of translocation-specific PCR. Arrowheads indicate each relevant primer. Diagram of the strategy used for estimation of translocation frequency by PCR. Genomic DNA was isolated from sperm samples. Translocation-specific PCR was performed using multiple batches of template DNA. Additional details of the methodology are described in Materials and Methods. The gel images show representative PCR results derived from sperm DNA samples. (B) Translocation frequency of PATRR3-related PCR. Lane *, PCR positive; Lane P, t(3;8) carrier. PCR products from 200ng of sperm DNA.

