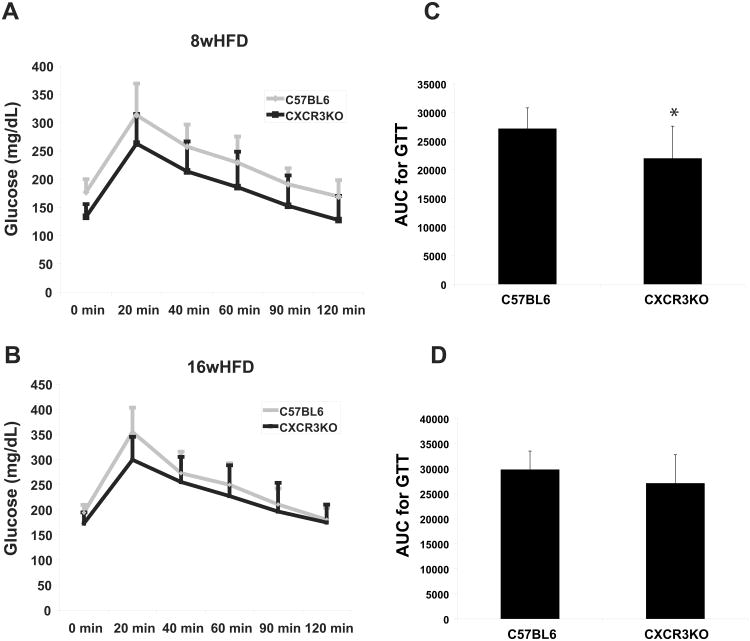
Figure 8.
Obese CXCR3-deficient mice exhibit improved glucose tolerance compared to obese wild-type mice.
Average glucose tolerance curves of CXCR3-deficient mice (black curves) and wild-type control mice (gray curves) after 8 weeks (A) and after 16 weeks (B) of high-fat diet (HFD). Areas under the glucose tolerance curves (AUC) were calculated for each mouse, and the average of each group is represented in C and D. Data are shown as mean ± SD.*p≤0.01; n=19-22/group.

