
Fig. 3.
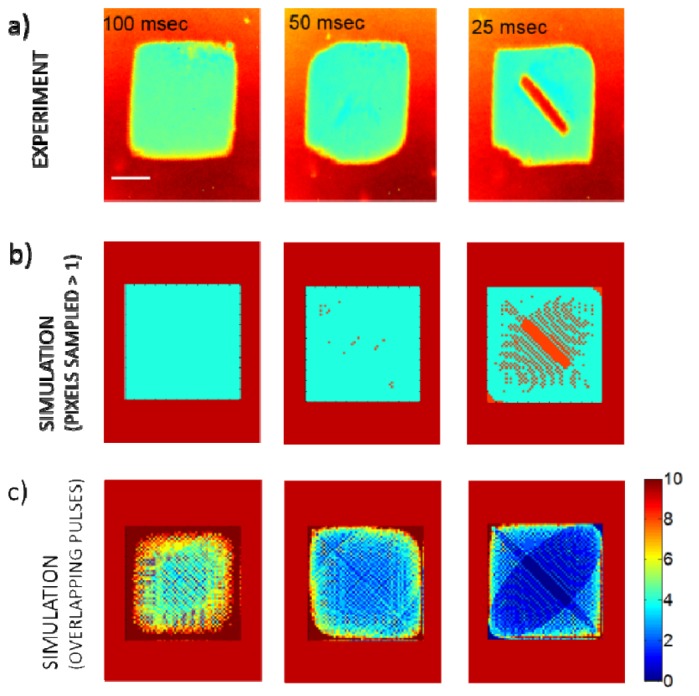
Ablation patterns at various laser exposure durations. a) Optical microscopy images of ablated gold film on glass slide for durations of 100 ms, 50 ms, and 25 ms. b) Simulated Lissajous patterns for all three durations within the experimental FOV of 150 μm × 150 μm, where pixels sampled at least once were marked in green and unsampled pixels were marked in orange. c) Simulation results indicating the number of overlapping pulses at each pixel. Scale bar is 50 μm.