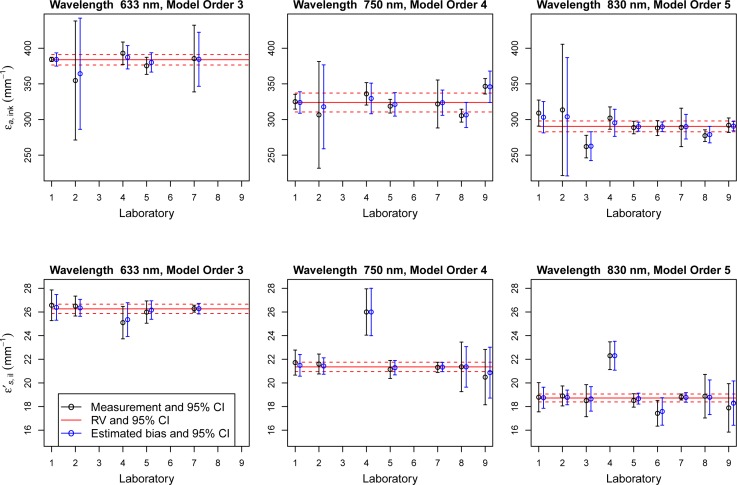
Fig. 2.
Measurements (black symbols) as well as reference values (RV, red lines) and laboratory biases (blue symbols, shifted) and their 95% CIs, estimated by fitting the fixed effect model (see Sec. 2.4) for the intrinsic absorption coefficient of undiluted India ink εa,ink (bottom row) and the intrinsic reduced scattering coefficient of IL (top row) at 3 different wavelengths. The laboratories are named using the ID number reported in Table 1.

