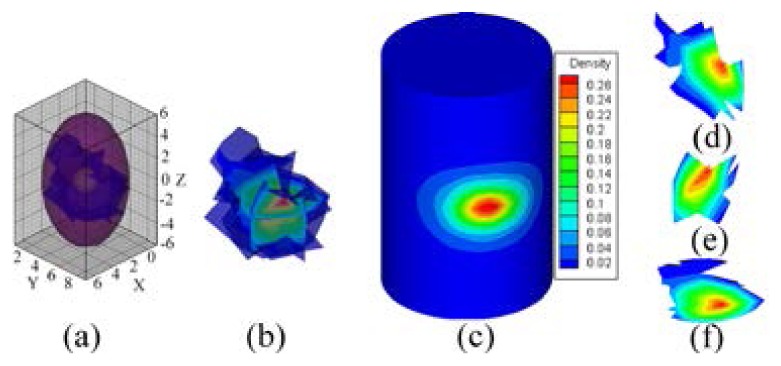
Fig. 8.

Reconstructed results of the probability method, where , and the ROI is cropped in along the z-axis. (a), (b) are the reconstructed PS. (c) normalized surface photon density calculated using APDD. (d)-(f) are the slices, which are perpendicular to the x, y, and z-axes at the probability core mm respectively.
