
Fig. 3.
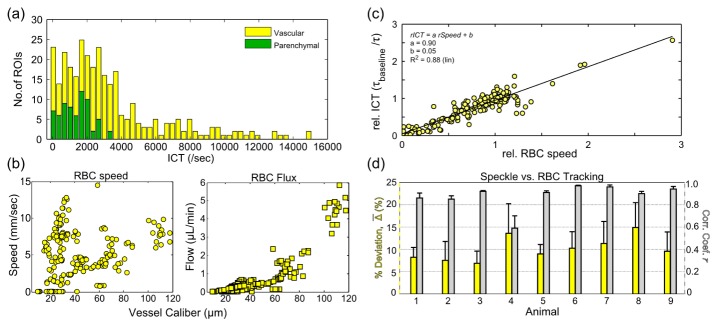
(a) Number of regions of interest (ROIs) with the corresponding inverse correlation times (ICTs) across all animals (n = 314 regions). (b) Red blood cell (RBC) speeds and their corresponding volumetric flux or flow versus vessel caliber. (c) Relative ICTs regressed against relative RBC speeds across all regions and animals. (d) Animal by animal percent deviations (yellow bars) between RBC tracking and MESI flow dynamics along with correlations of their chronic flow dynamics (gray bars). Averages ± std. dev. (errorbars) are across vascular regions.