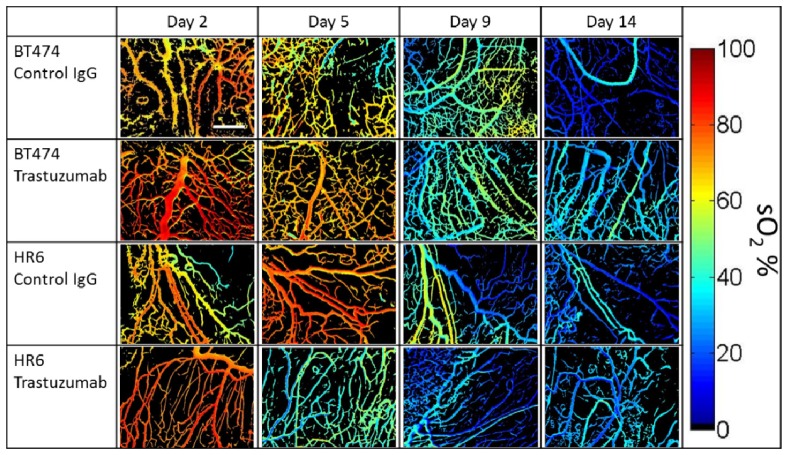
Fig. 3.
Representative in vivo hyperspectral time-courses for a single mouse in each treatment group. Colormap indicates sO2 percentage, from 0% (dark blue) to 100% (dark red). Non-vascular tissue is segmented out and indicated by black background. Changes in microvascular morphology and sO2 are seen in all treatment groups. Scale bar (500 microns) is in BT474 Control IgG, Day 2 image.

