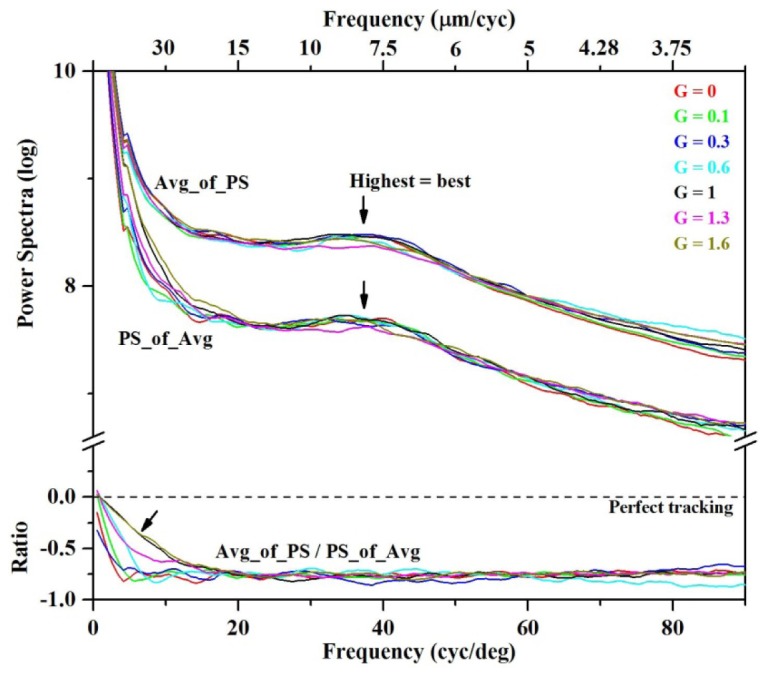
Fig. 9.

Spatial performance of the tracker system. (top) Average power spectra are plotted for en face images of cone photoreceptors for seven gain levels of the tracker (G = 0, 0.1, 0.3, 0.6, 1, 1.3, 1.6). Images for the seven gains were acquired in consecutive sessions on subject #2 (6° nasal to the fovea). Each average power spectrum was computed from the 13 AO-OCT images that composed the session. Two different average power spectra are shown, PS_of_Avg (Eq. (1) and Avg_of_PS (Eq. (2), the former sensitive to eye motion and the latter insensitive. Spectra were circumferentially averaged. Note the semilog ordinate. No image registration was applied. (bottom) Ratios of PS_of_Avg to Avg_of_PS are shown using the traces in the top plot. Ratios correspond to Eqs. (3) and (4). Because of the semilog ordinate in the top plot, the ratio is equal to the difference between the log traces.
