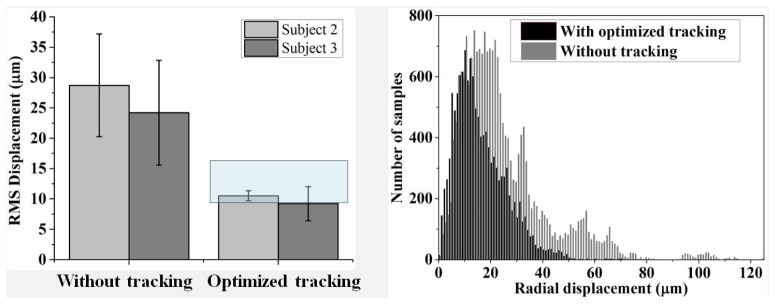
Fig. 11.

Stabilization of the tracking AO-OCT system over 20 imaging sessions: five imaging sessions per tracking case per subject. Images were acquired with imaging mode #2, and motion displacements measured with strip-wise registration. (left) RMS displacement is across all 13 volumes of the same session and averaged across five sessions. Error bars denote +/− one standard deviation of displacements across the five sessions. Superimposed on the tracking portion of the plot is a semitransparent box that marks the approximate performance range of earlier versions of the PSI tracker reported in the literature [24, 31] (right). Histograms show the radial displacements measured relative to the reference frame of each session. Separate histograms are shown with and without tracking, each combining the measurements from ten sessions, five from subjects 2 and five from subject 3.
