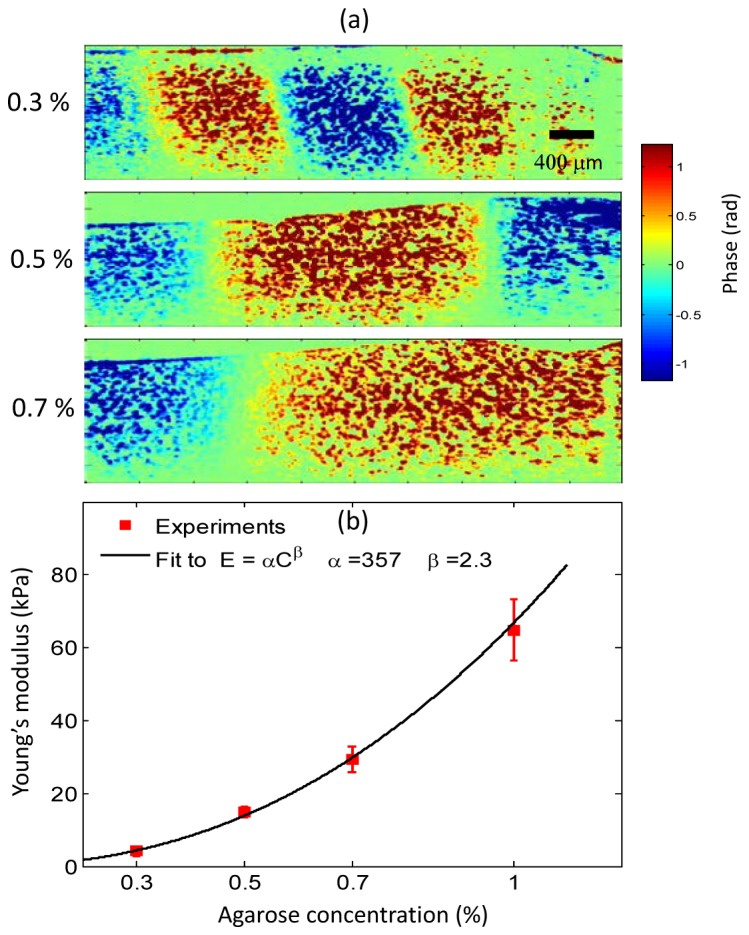
Fig. 3.

Shear waves in elastically homogeneous phantoms. The MNP inclusions (not shown) are on the right side of the images (a) Visualization of shear waves with phantoms of different agarose concentrations. A line-scan rate of ~92 kHz and 4000 A-lines per M-mode were collected. A sinusoidal excitation at 500 Hz consisting of 20 cycles was used. An increase in the shear wavelength and speed can be seen as the gel stiffness increases (Media 1 (9MB, AVI) ). (b) Estimated Young’s moduli at different agarose concentrations. A line-scan rate of ~46 kHz, 2000 A-lines per M-mode and 10 cycles at a excitation frequency of 500 Hz was used for these measurements. The error bars correspond to the standard deviation of the measured values at 3 different spatial locations within the same sample (N = 3). The error bars for 0.3% and 0.5% are too small to see, and the values correspond to 4.14 ± 0.25 kPa and 15 ± 1.47 kPa, respectively.
